
TF
TradifyFX Team
·
2
min read
What every number on the Analytics page actually means.
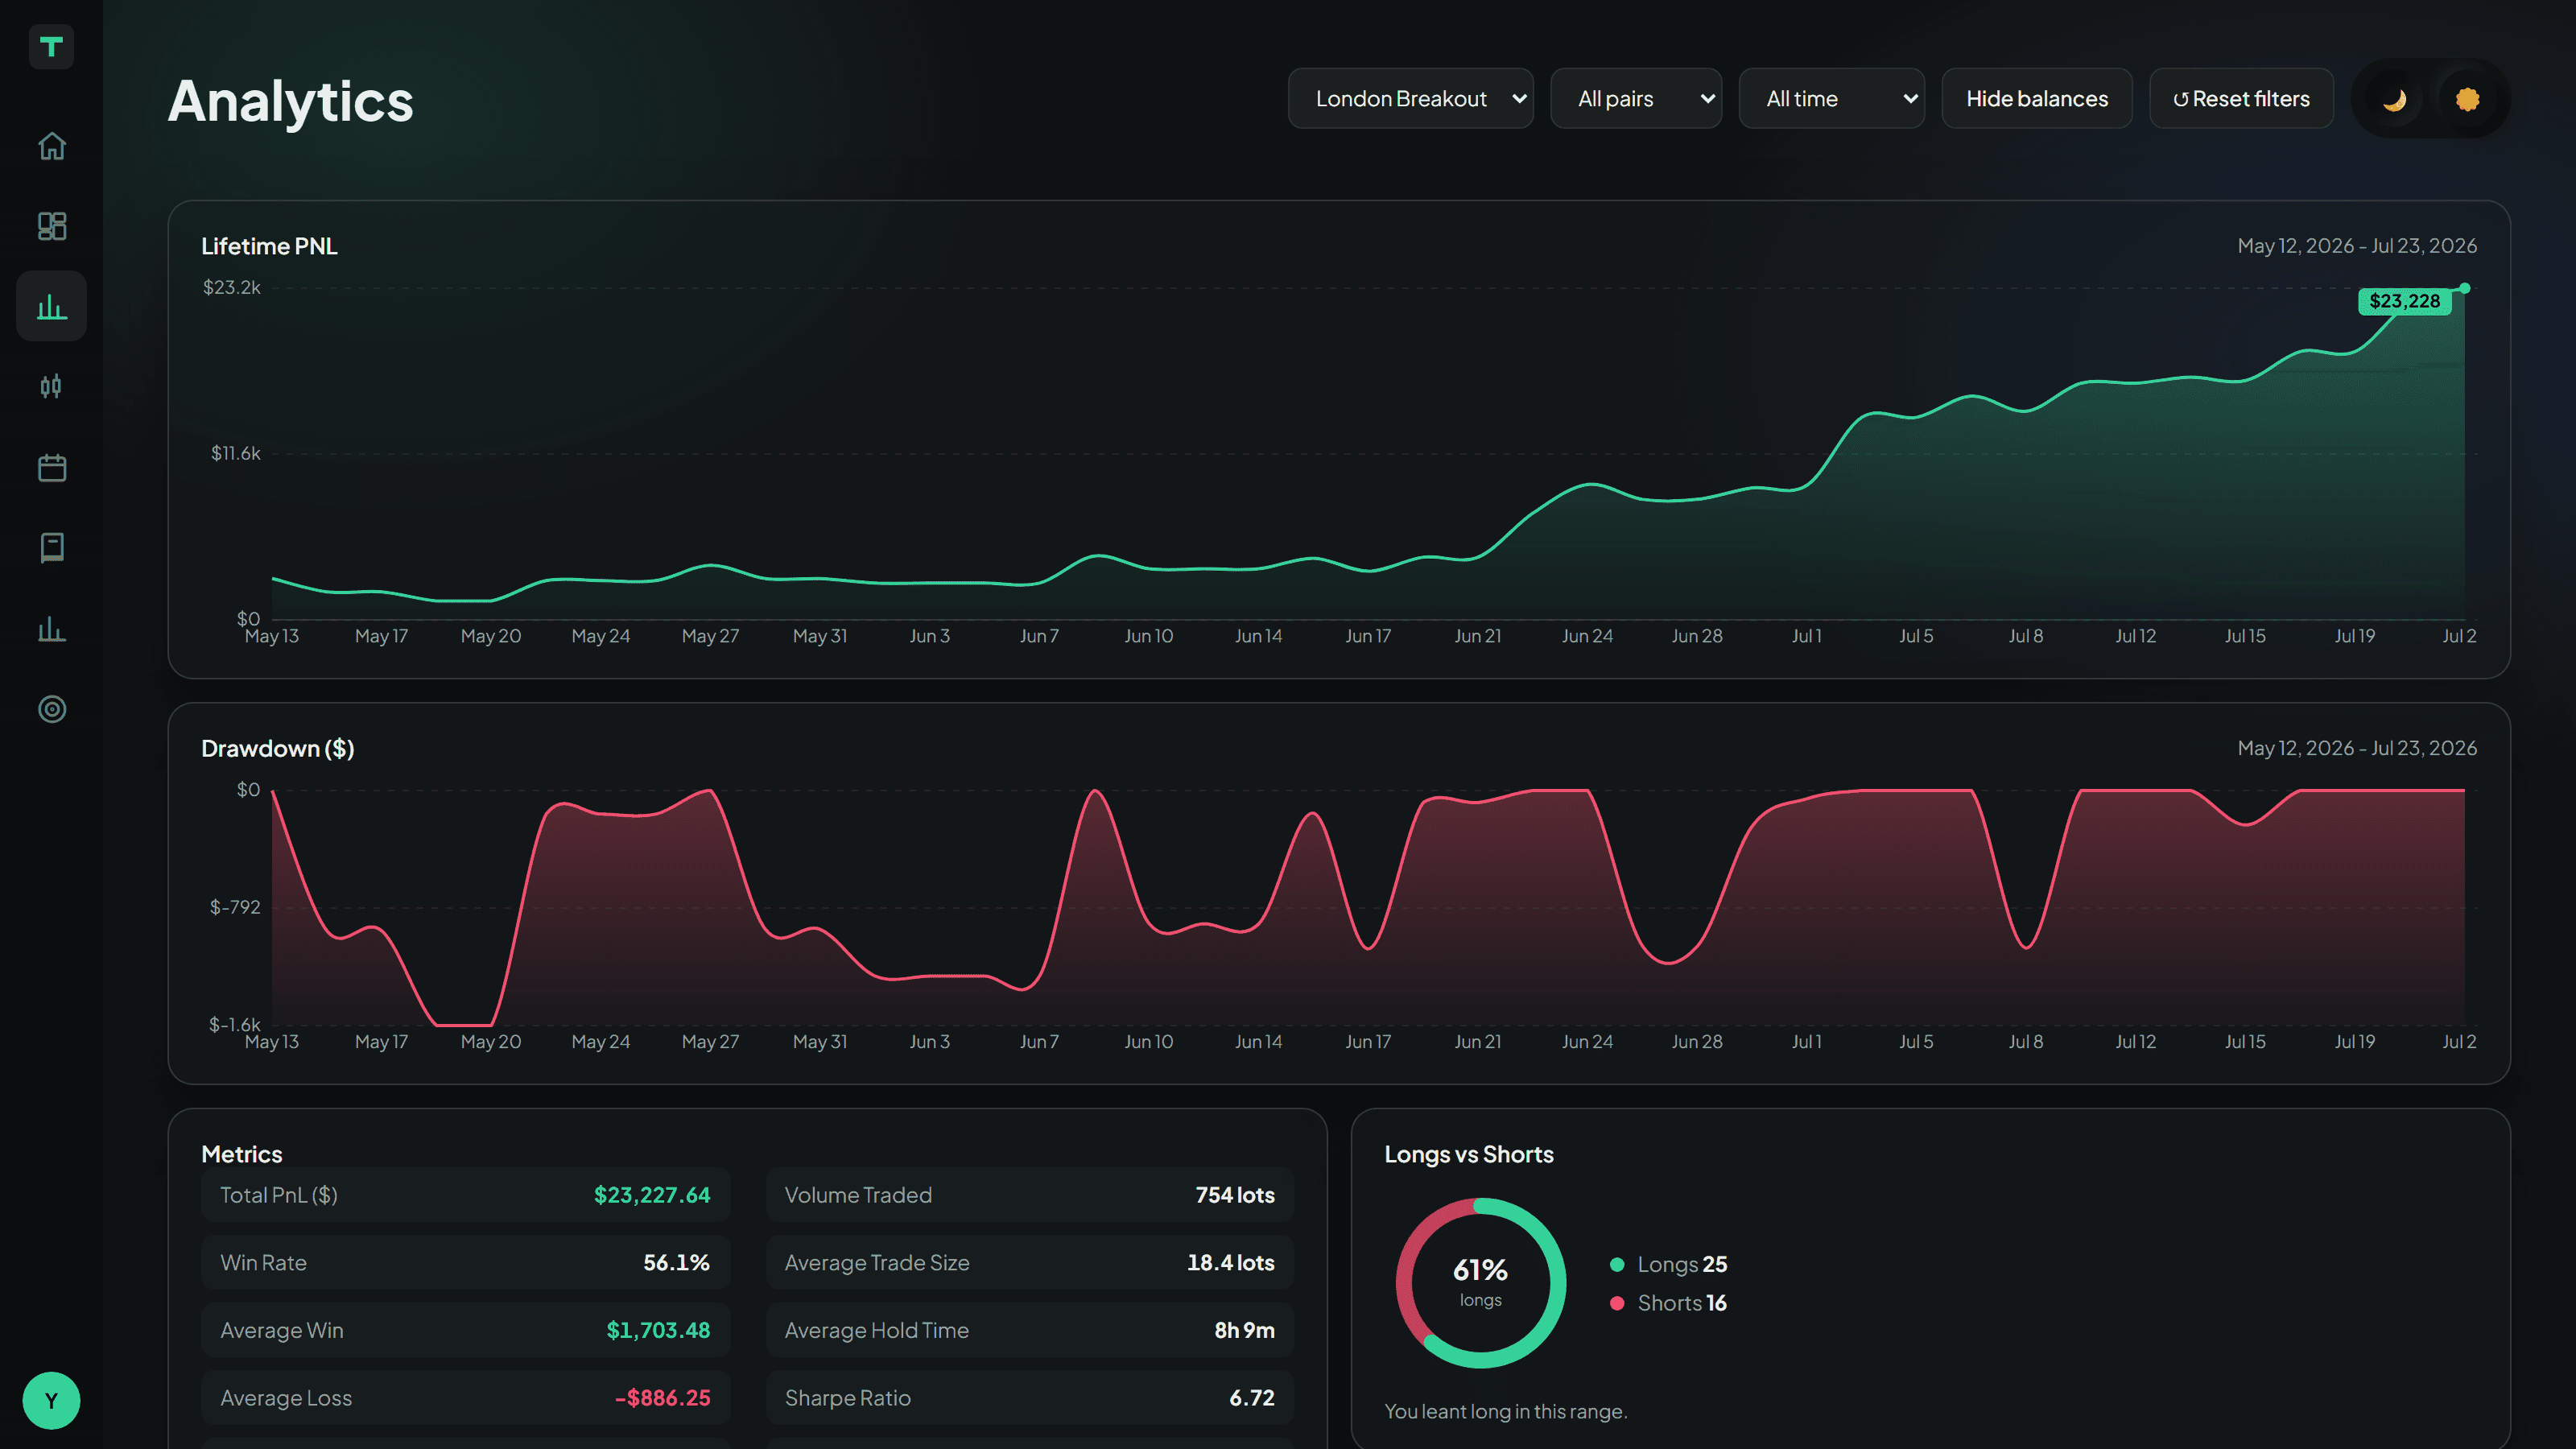
The two curves
Lifetime P&L is your running total, trade by trade. The shape matters more than the end point — a steady climb and a lucky spike finish in the same place and mean completely different things.
Drawdown shows how far below your best point you were at any moment. This is the one that tells you whether you could actually have traded this without giving up.
The metrics
Metric | What it means | What to want |
|---|---|---|
Total P&L | Everything added up, costs included | Positive |
Win rate | Percentage of trades that made money | Less than you think — see below |
Average win / loss | Typical size of each | Wins bigger than losses |
Profit factor | Money made ÷ money lost | Above 1.0; above 1.5 is strong |
Expected value | What one average trade is worth | Positive |
Max drawdown | Worst peak-to-trough fall | As small as you can stand |
Sharpe / Sortino | Return against volatility; Sortino counts only downside | Higher |
Average MAE | How far trades went against you before working | Small |
Average MFE | How far they went your way before you closed | Compare with what you took |
MFE/MAE ratio | Reward available against pain endured | Above 1 |
Average hold time | How long you stay in | Consistent |
Average trade size | Typical position | Consistent — spikes mean tilt |
A high win rate proves nothing on its own. Winning 80% of the time while your losers are five times your winners is a losing strategy. Read win rate next to average win and average loss, or just read profit factor, which combines them.
Longs versus shorts
A donut splitting your trades by direction. A strong lean one way is worth knowing — many traders are quietly only good in one direction, and half their trades are funding the other half.
The breakdowns
Four views, each answering a different question:
Hold time — do quick trades or long ones treat you better?
Trading session — London, New York or Tokyo?
Day of week — is one weekday quietly expensive?
Time of day — which hour do you actually trade well?
These are usually where the useful surprise is.
What if?
At the bottom, a panel prices what you left behind — how much more was available in trades you closed early, and how far your losers typically ran against you before you let them go.
Filters
Strategy, market and date range across the top, shared with the Journal and Dashboard. Always check the strategy filter before reading anything — mixing three strategies together produces an average that describes none of them.
Related articles
In this topic
Still stuck?
Tell us the strategy name and roughly when it happened, and we’ll look at the exact session.
Contact support


