
TF
TradifyFX Team
·
1
min read
Green days, red days, and the pattern across a month.
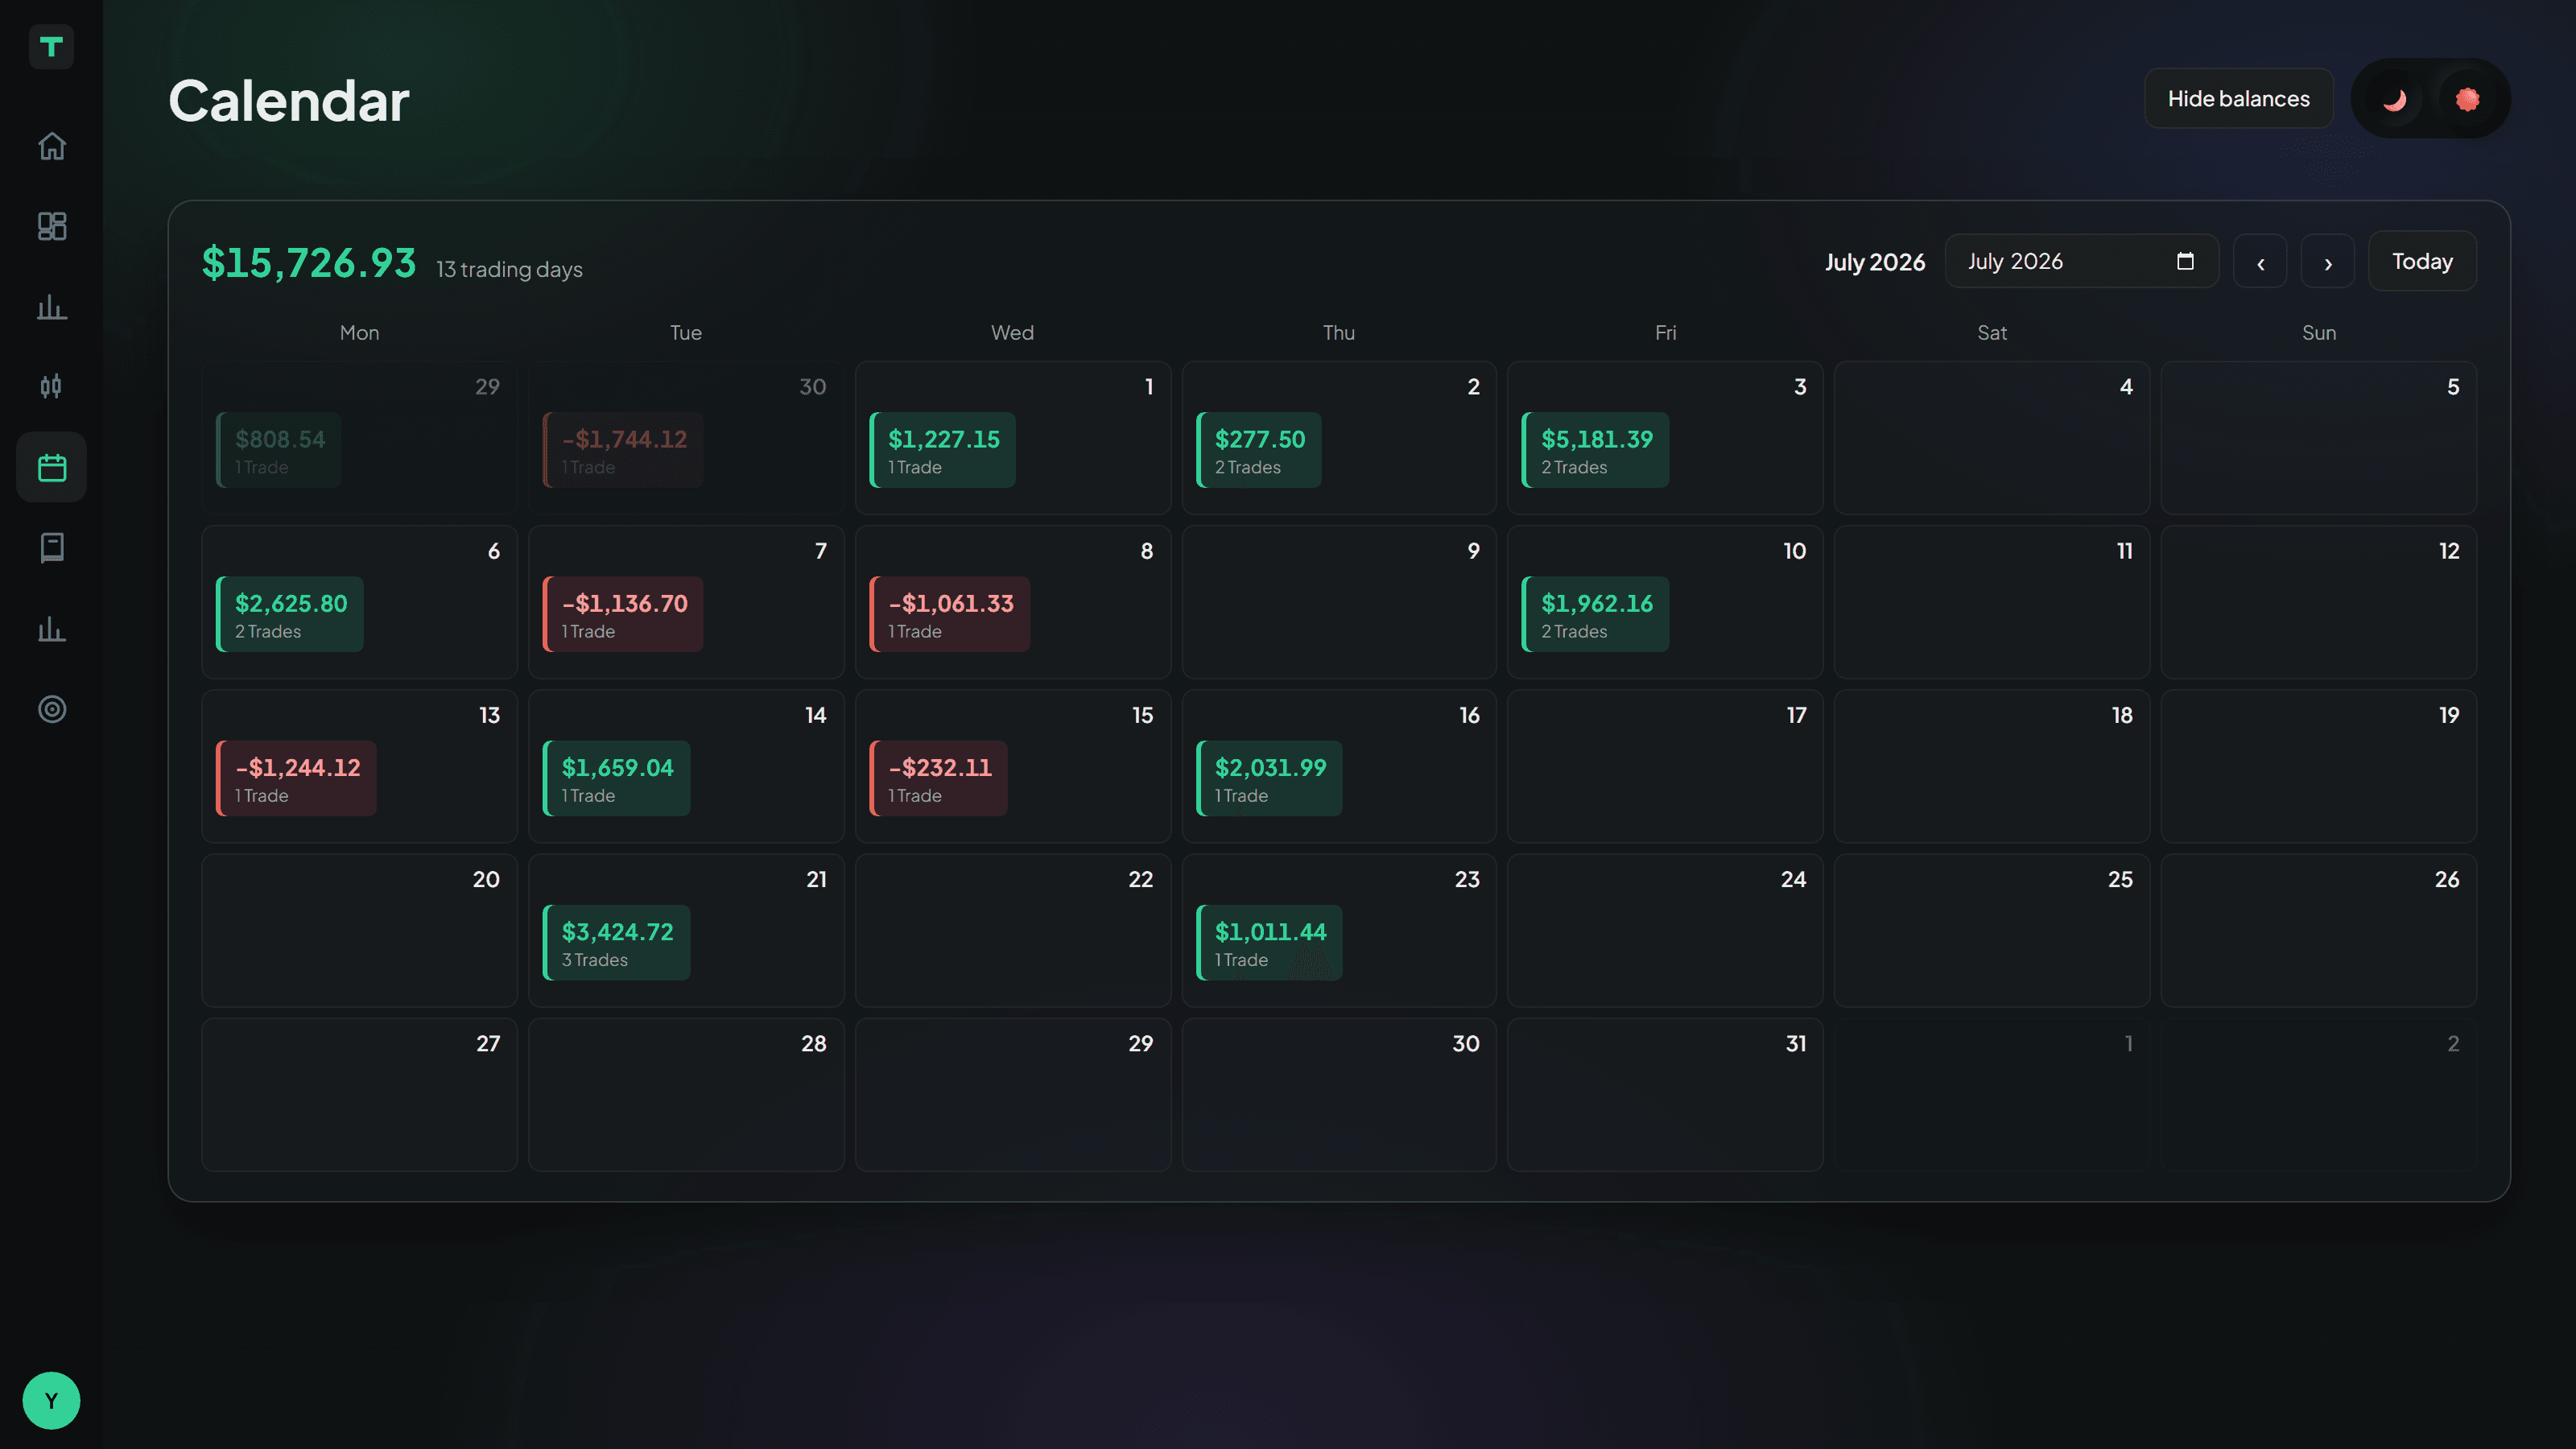
Every trading day as a tile, coloured by result — green for up, red for down — with the amount and the number of trades on each.
The header gives you the month’s total and how many days you actually traded.
What to look for
The calendar is the fastest way to see things a table hides:
One catastrophic day among many small green ones — a sizing problem, not a strategy problem
Clusters of red — losing streaks you traded through instead of stopping
Days with far more trades than usual — nearly always your worst days
That last one is worth checking specifically. Overtrading shows up on a calendar long before it shows up in a win rate.
Opening a day
Click any tile to see the trades behind it, and from there jump to any of them on the chart.
Moving around
Arrows step month by month, the picker jumps anywhere, and Today comes back.
The calendar opens on the month of your most recent session rather than the real-world month — if you spent the evening replaying March 2024, that is what you want to see.
Days are grouped using the timezone in Settings → Account. If your trading day does not start at midnight UTC, set it there and the day boundaries will match how you actually think.
Related articles
In this topic
Still stuck?
Tell us the strategy name and roughly when it happened, and we’ll look at the exact session.
Contact support


