Everything you need to practise properly

Replay real market history, place real orders against it, and get every session scored. The only thing missing from your practice is the risk.

Filmed in TradifyFX on a demo account. All trades are simulated.

  • EUR/USD

  • GBP/USD

  • XAU/USD

  • US30

  • USD/JPY

  • SPX500

  • NAS100

  • WTI CRUDE

  • GER40

  • AUD/USD

  • NATGAS

  • USD/CAD

  • EUR/USD

  • GBP/USD

  • XAU/USD

  • US30

  • USD/JPY

  • SPX500

  • NAS100

  • WTI CRUDE

  • GER40

  • AUD/USD

  • NATGAS

  • USD/CAD

  • EUR/USD

  • GBP/USD

  • XAU/USD

  • US30

  • USD/JPY

  • SPX500

  • NAS100

  • WTI CRUDE

  • GER40

  • AUD/USD

  • NATGAS

  • USD/CAD

See every screen before you sign up

Click a tab to see that part of the app. Every clip is filmed in TradifyFX on a demo account.

Replay

Dashboard

Analytics

Calendar

Journal

Reports

Challenges

Pick a market and a date, then trade it candle by candle with the future hidden.

Built on TradingView

The chart you already know.
Now with a rewind button.

The chart you already know.
Now with a rewind button.

TradifyFX is built on TradingView’s charting library, so the indicators, drawing tools and timeframes are the ones you already use. The difference: you choose the date, and the future stays hidden until you step into it.

Built on TradingView

The chart you already know.
Now with a rewind button.

TradifyFX is built on TradingView’s charting library, so the indicators, drawing tools and timeframes are the ones you already use. The difference: you choose the date, and the future stays hidden until you step into it.

1

2

3

4

1

2

3

4

01

Indicators

106

Built in — RSI, MACD, Ichimoku Cloud, VWAP and the rest. Search by name, add in one click.

01

Indicators

106

Built in — RSI, MACD, Ichimoku Cloud, VWAP and the rest. Search by name, add in one click.

02

Drawing tools

85

Lines, channels, pitchforks, Fibonacci, Gann, patterns, shapes and notes.

02

Drawing tools

85

Lines, channels, pitchforks, Fibonacci, Gann, patterns, shapes and notes.

03

Timeframes

19

From 5-second bars to monthly candles, drawn in 12 chart types.

03

Timeframes

19

From 5-second bars to monthly candles, drawn in 12 chart types.

04

Replay

16×

Play, step, jump to a date, or watch each candle build tick by tick.

04

Replay

16×

Play, step, jump to a date, or watch each candle build tick by tick.

Indicators

106 indicators, one search away

Every built-in study in TradingView’s charting library, plus two we made for replay: Trading sessions and Previous day high/low.

  • Moving Average Exponential

  • Bollinger Bands

  • Relative Strength Index

  • Trading sessions

  • MACD

  • Ichimoku Cloud

  • VWAP

  • Stochastic

  • Average True Range

  • Parabolic SAR

  • Pivot Points Standard

  • SuperTrend

  • Donchian Channels

  • Average Directional Index

  • Stochastic RSI

  • Commodity Channel Index

  • Hull Moving Average

  • On Balance Volume

  • Previous day high/low

  • Money Flow Index

  • Aroon

  • Awesome Oscillator

  • Chaikin Money Flow

  • Fisher Transform

  • Know Sure Thing

  • Keltner Channels

  • Volume Profile Visible Range

  • Zig Zag

  • Williams Alligator

  • Williams Fractal

  • Rate Of Change

  • TRIX

  • True Strength Index

  • Vortex Indicator

  • Guppy Multiple Moving Average

  • Historical Volatility

  • Envelopes

  • Price Channel

  • Linear Regression Curve

  • Arnaud Legoux Moving Average

  • McGinley Dynamic

  • Connors RSI

  • Ultimate Oscillator

  • Chande Momentum Oscillator

  • Choppiness Index

  • Detrended Price Oscillator

  • Coppock Curve

  • Klinger Oscillator

  • Relative Vigor Index

  • Mass Index

  • Balance of Power

  • Volume Profile Fixed Range

Indicators

106 indicators, one search away

Every built-in study in TradingView’s charting library, plus two we made for replay: Trading sessions and Previous day high/low.

  • Moving Average Exponential

  • Bollinger Bands

  • Relative Strength Index

  • Trading sessions

  • MACD

  • Ichimoku Cloud

  • VWAP

  • Stochastic

  • Average True Range

  • Parabolic SAR

  • Pivot Points Standard

  • SuperTrend

  • Donchian Channels

  • Average Directional Index

  • Stochastic RSI

  • Commodity Channel Index

  • Hull Moving Average

  • On Balance Volume

  • Previous day high/low

  • Money Flow Index

  • Aroon

  • Awesome Oscillator

  • Chaikin Money Flow

  • Fisher Transform

  • Know Sure Thing

  • Keltner Channels

  • Volume Profile Visible Range

  • Zig Zag

  • Williams Alligator

  • Williams Fractal

  • Rate Of Change

  • TRIX

  • True Strength Index

  • Vortex Indicator

  • Guppy Multiple Moving Average

  • Historical Volatility

  • Envelopes

  • Price Channel

  • Linear Regression Curve

  • Arnaud Legoux Moving Average

  • McGinley Dynamic

  • Connors RSI

  • Ultimate Oscillator

  • Chande Momentum Oscillator

  • Choppiness Index

  • Detrended Price Oscillator

  • Coppock Curve

  • Klinger Oscillator

  • Relative Vigor Index

  • Mass Index

  • Balance of Power

  • Volume Profile Fixed Range

Chart types

12 ways to draw a candle

Real EUR/USD hourly candles from 5–8 March 2024, redrawn in every type the chart offers. Hover to pause; tap a line to pick one.

Candles
01 / 12
1.09514

Chart types

12 ways to draw a candle

Real EUR/USD hourly candles from 5–8 March 2024, redrawn in every type the chart offers. Hover to pause; tap a line to pick one.

Candles
01 / 12
1.09514

Drawing tools

85 drawing tools in six toolbars

Trend lines, channels and pitchforks. Fibonacci and Gann. Harmonic and Elliott patterns, shapes, notes and price ranges. Everything snaps to the candles with the magnet on.

Parallel channel + XABCD pattern · EUR/USD 1h · 1–7 Mar 2024

Drawing tools

85 drawing tools in six toolbars

Trend lines, channels and pitchforks. Fibonacci and Gann. Harmonic and Elliott patterns, shapes, notes and price ranges. Everything snaps to the candles with the magnet on.

Parallel channel + XABCD pattern · EUR/USD 1h · 1–7 Mar 2024

Timeframes

19 timeframes

From a 5-second bar to a monthly candle.

Seconds

5s

10s

15s

30s

Minutes

1m

2m

3m

4m

5m

10m

15m

30m

45m

Hours

1h

2h

4h

Days and up

1D

1W

1M

5 seconds

1 month

Timeframes

19 timeframes

From a 5-second bar to a monthly candle.

Seconds

5s

10s

15s

30s

Minutes

1m

2m

3m

4m

5m

10m

15m

30m

45m

Hours

1h

2h

4h

Days and up

1D

1W

1M

5 seconds

1 month

Shortcuts

Hands stay on the keys

Run a whole session without reaching for the mouse.

Space

Play or pause

← →

Step back, step on

B

Buy

S

Sell

1–5

Speed

L

Live pace

T

Bars or ticks

Esc

Close the ticket

Long and short position tools

Draw the trade, then take it

Drag out a long or short position on the chart and the order ticket fills in your entry, stop and target. Move the drawing and the ticket follows. Every trade is simulated.

Long position tool → order ticket → live trade · EUR/USD 1h · 13 Mar 2024 · demo account

Long and short position tools

Draw the trade, then take it

Drag out a long or short position on the chart and the order ticket fills in your entry, stop and target. Move the drawing and the ticket follows. Every trade is simulated.

Long position tool → order ticket → live trade · EUR/USD 1h · 13 Mar 2024 · demo account

Multi-chart

Four charts, one clock

Line up markets or timeframes and they step together. Here: EUR/USD, GBP/USD, gold and the Wall St 30 into the US jobs report.

Multi-chart

Four charts, one clock

Line up markets or timeframes and they step together. Here: EUR/USD, GBP/USD, gold and the Wall St 30 into the US jobs report.

Layout memory

Comes back as you left it

Your chart saves to the strategy as you work, and reopens with it.

✓ Saved 13:28

✓

Drawings

✓

Indicators and settings

✓

Charts and timeframes

Layout memory

Comes back as you left it

Your chart saves to the strategy as you work, and reopens with it.

✓ Saved 13:28

✓

Drawings

✓

Indicators and settings

✓

Charts and timeframes

The fine print

What isn’t here

Pine Script, community scripts and price alerts belong to TradingView’s own platform, not the charting library, so they don’t run in TradifyFX. Everything else on this page does.

The fine print

What isn’t here

Pine Script, community scripts and price alerts belong to TradingView’s own platform, not the charting library, so they don’t run in TradifyFX. Everything else on this page does.

TradingView is a trademark of TradingView, Inc. TradifyFX uses TradingView’s Advanced Charts library under licence and is not affiliated with or endorsed by TradingView. Clips filmed in TradifyFX on a demo account; all trades are simulated.

Two ways to print every candle

Step through history a whole candle at a time, or watch each candle build from the real price inside it. You choose when you start a session.

Bar by bar

One click, one finished candle

The quickest way through a session. Each step closes a whole candle on your timeframe, and autoplay runs at up to 16× speed.

Tick by tick

Watch every candle form

Each candle is built from about a dozen finer real bars — 1-minute bars on the 15-minute chart above, 5-minute bars on an hourly one — so highs, lows and wicks form in front of you, and your stop and target are checked at every step.

Your dashboard

Build the dashboard you actually look at

Twenty-two widgets, three sizes, and you decide where every one goes. Your layout is saved to your account, so it is waiting for you on any device.

Drag any card to a new spot.

Make a card small, medium or large.

Add from 22 widgets, from win rate to maximum drawdown.

Everything you need to review, filled in for you

Close a trade and it lands in your journal, calendar, analytics and reports on its own. No spreadsheets.
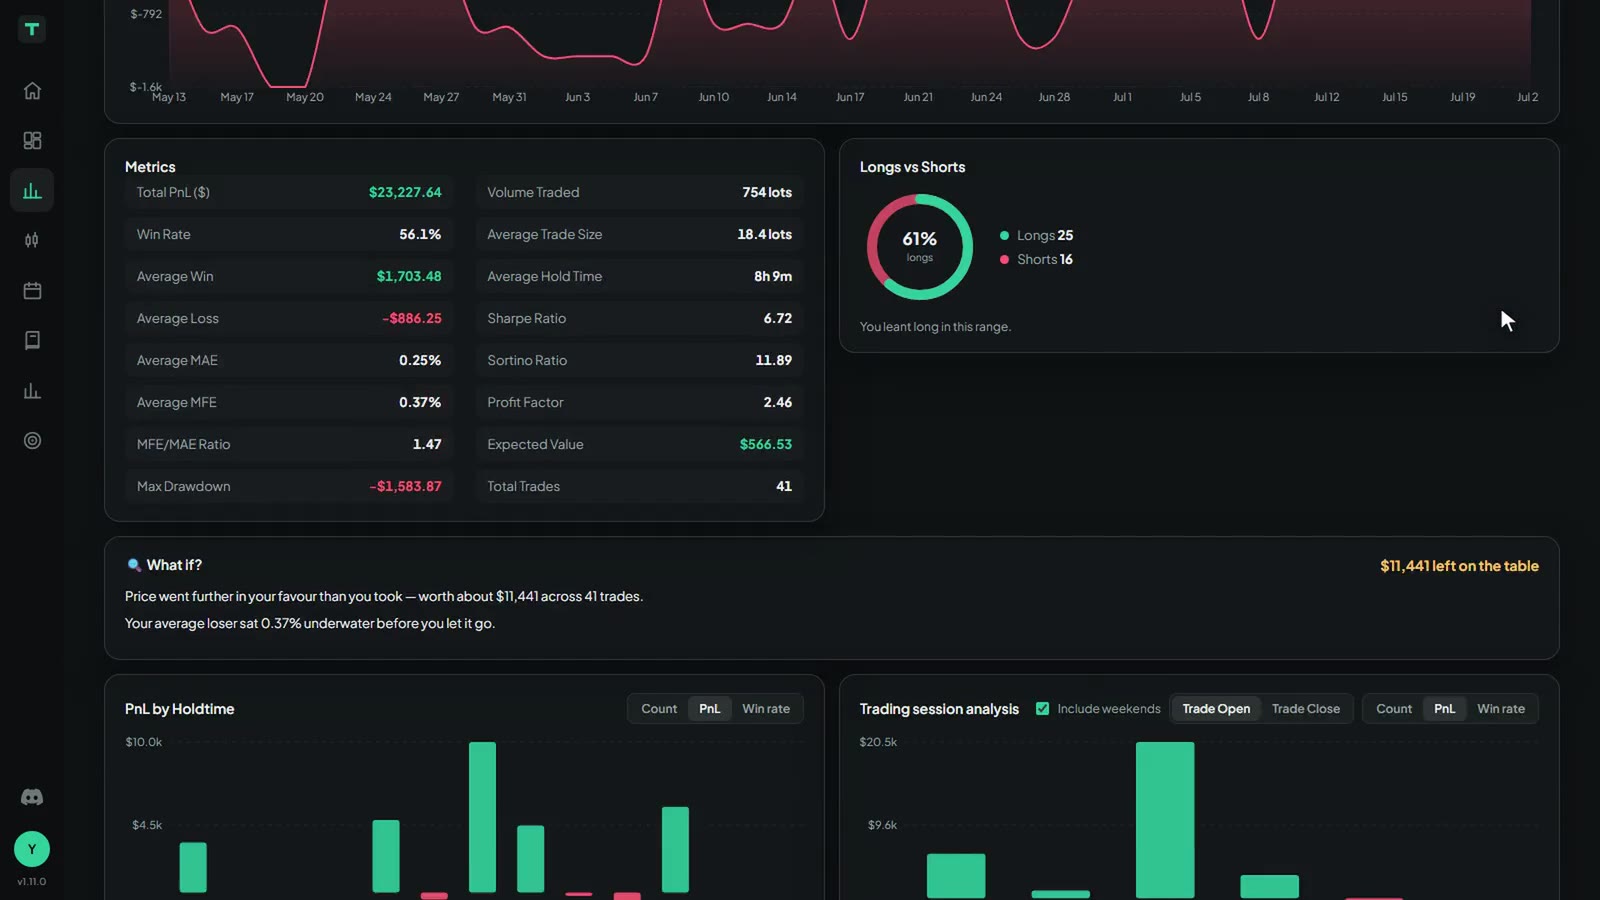
TradifyFX analytics: metrics table, longs versus shorts and P&L by hold time

Numbers you’d never work out by hand

Win rate, expectancy, payoff ratio, drawdown and profit factor, with breakdowns by session, weekday and hold time.

TradifyFX calendar: a month of trading days marked green and red

Every day, green or red

See the month at a glance. Each day shows its result, and the trades behind it are one click away.

TradifyFX journal: an open trade with grade, habit tags and chart snapshot

Every trade, logged and graded

Grade each trade, tag the habit behind it, add a note and a chart snapshot, then replay it on the chart.

TradifyFX reports: habits, timing, strategy and risk findings

Your costliest habit, named

Reports find the pattern that costs you most, put a price on it and compare this month with the last.

Market replay

Replay any moment in history

Pick a market, a date and a time. The chart loads with the future hidden, so you trade the day exactly as it happened and never know what comes next.

123 markets: 68 forex pairs, 18 indices, metals, energy, agriculture and bonds.

History back to 2005 on the majors, with seconds timeframes as well as minutes.

Step bar by bar, or watch each candle print tick by tick.

TradifyFX market replay chart, replayed candle by candle

Market replay

Replay any moment in history

Pick a market, a date and a time. The chart loads with the future hidden, so you trade the day exactly as it happened and never know what comes next.

123 markets: 68 forex pairs, 18 indices, metals, energy, agriculture and bonds.

History back to 2005 on the majors, with seconds timeframes as well as minutes.

Step bar by bar, or watch each candle print tick by tick.

TradifyFX market replay chart, replayed candle by candle

Prop firm challenges

Sit the challenge before you pay for it

Daily loss limits, maximum drawdown and profit targets, enforced trade by trade the same way the real challenge enforces them.

Four rule shapes and five account sizes, or type your own numbers.

Breach a rule at any moment and the run fails — no second chances, same as the real thing.

Share a result card that re-checks itself against your recorded trades.

TradifyFX prop-firm challenge with live rule tracking

Prop firm challenges

Sit the challenge before you pay for it

Daily loss limits, maximum drawdown and profit targets, enforced trade by trade the same way the real challenge enforces them.

Four rule shapes and five account sizes, or type your own numbers.

Breach a rule at any moment and the run fails — no second chances, same as the real thing.

Share a result card that re-checks itself against your recorded trades.

TradifyFX prop-firm challenge with live rule tracking

Multi-chart

Four charts on one clock

Open up to four charts side by side — different pairs, or the same pair on different timeframes — and they all step forward together.

Watch EUR/USD, gold and an index move at the same moment.

Put the 5-minute and the 1-hour of one pair next to each other.

Add, close or enlarge a chart without leaving the session.

Four synchronised TradifyFX charts in one replay session

Multi-chart

Four charts on one clock

Open up to four charts side by side — different pairs, or the same pair on different timeframes — and they all step forward together.

Watch EUR/USD, gold and an index move at the same moment.

Put the 5-minute and the 1-hour of one pair next to each other.

Add, close or enlarge a chart without leaving the session.

Four synchronised TradifyFX charts in one replay session

Everything included,
on every plan.

No feature tiers and no add-ons. One subscription, the whole tool.

123

markets: forex, indices, metals, energy, agriculture and bonds

2005

how far back the major pairs go

5 sec

the smallest candle, all the way up to monthly

16×

the top replay speed

Your next challenge attempt shouldn’t be your first practice.

30 days free. No card needed.

Your next challenge attempt shouldn’t be your first practice.

30 days free. No card needed.

Your next challenge attempt
shouldn’t be your first practice.

30 days free. No card needed.

© 2026 TradifyFX. Simulated trading on historical data. No real money. Not financial advice.

Instagram
X
TikTok

TradifyFX is a market simulator. Simulated performance does not predict real trading results. Not affiliated with any proprietary trading firm.

© 2026 TradifyFX. Simulated trading on historical data. No real money. Not financial advice.

Instagram
X
TikTok

TradifyFX is a market simulator. Simulated performance does not predict real trading results. Not affiliated with any proprietary trading firm.

© 2026 TradifyFX. Simulated trading on historical data. No real money. Not financial advice.

Instagram
X
TikTok

TradifyFX is a market simulator. Simulated performance does not predict real trading results. Not affiliated with any proprietary trading firm.