
TF
TradifyFX Team
·
3
min read
A complete session from setup to summary, in about ten minutes.
This walks you through one full session — setting it up, stepping through history, placing a trade, closing it, and reading the result. Follow it exactly the first time; you can experiment afterwards.
Open the setup screen
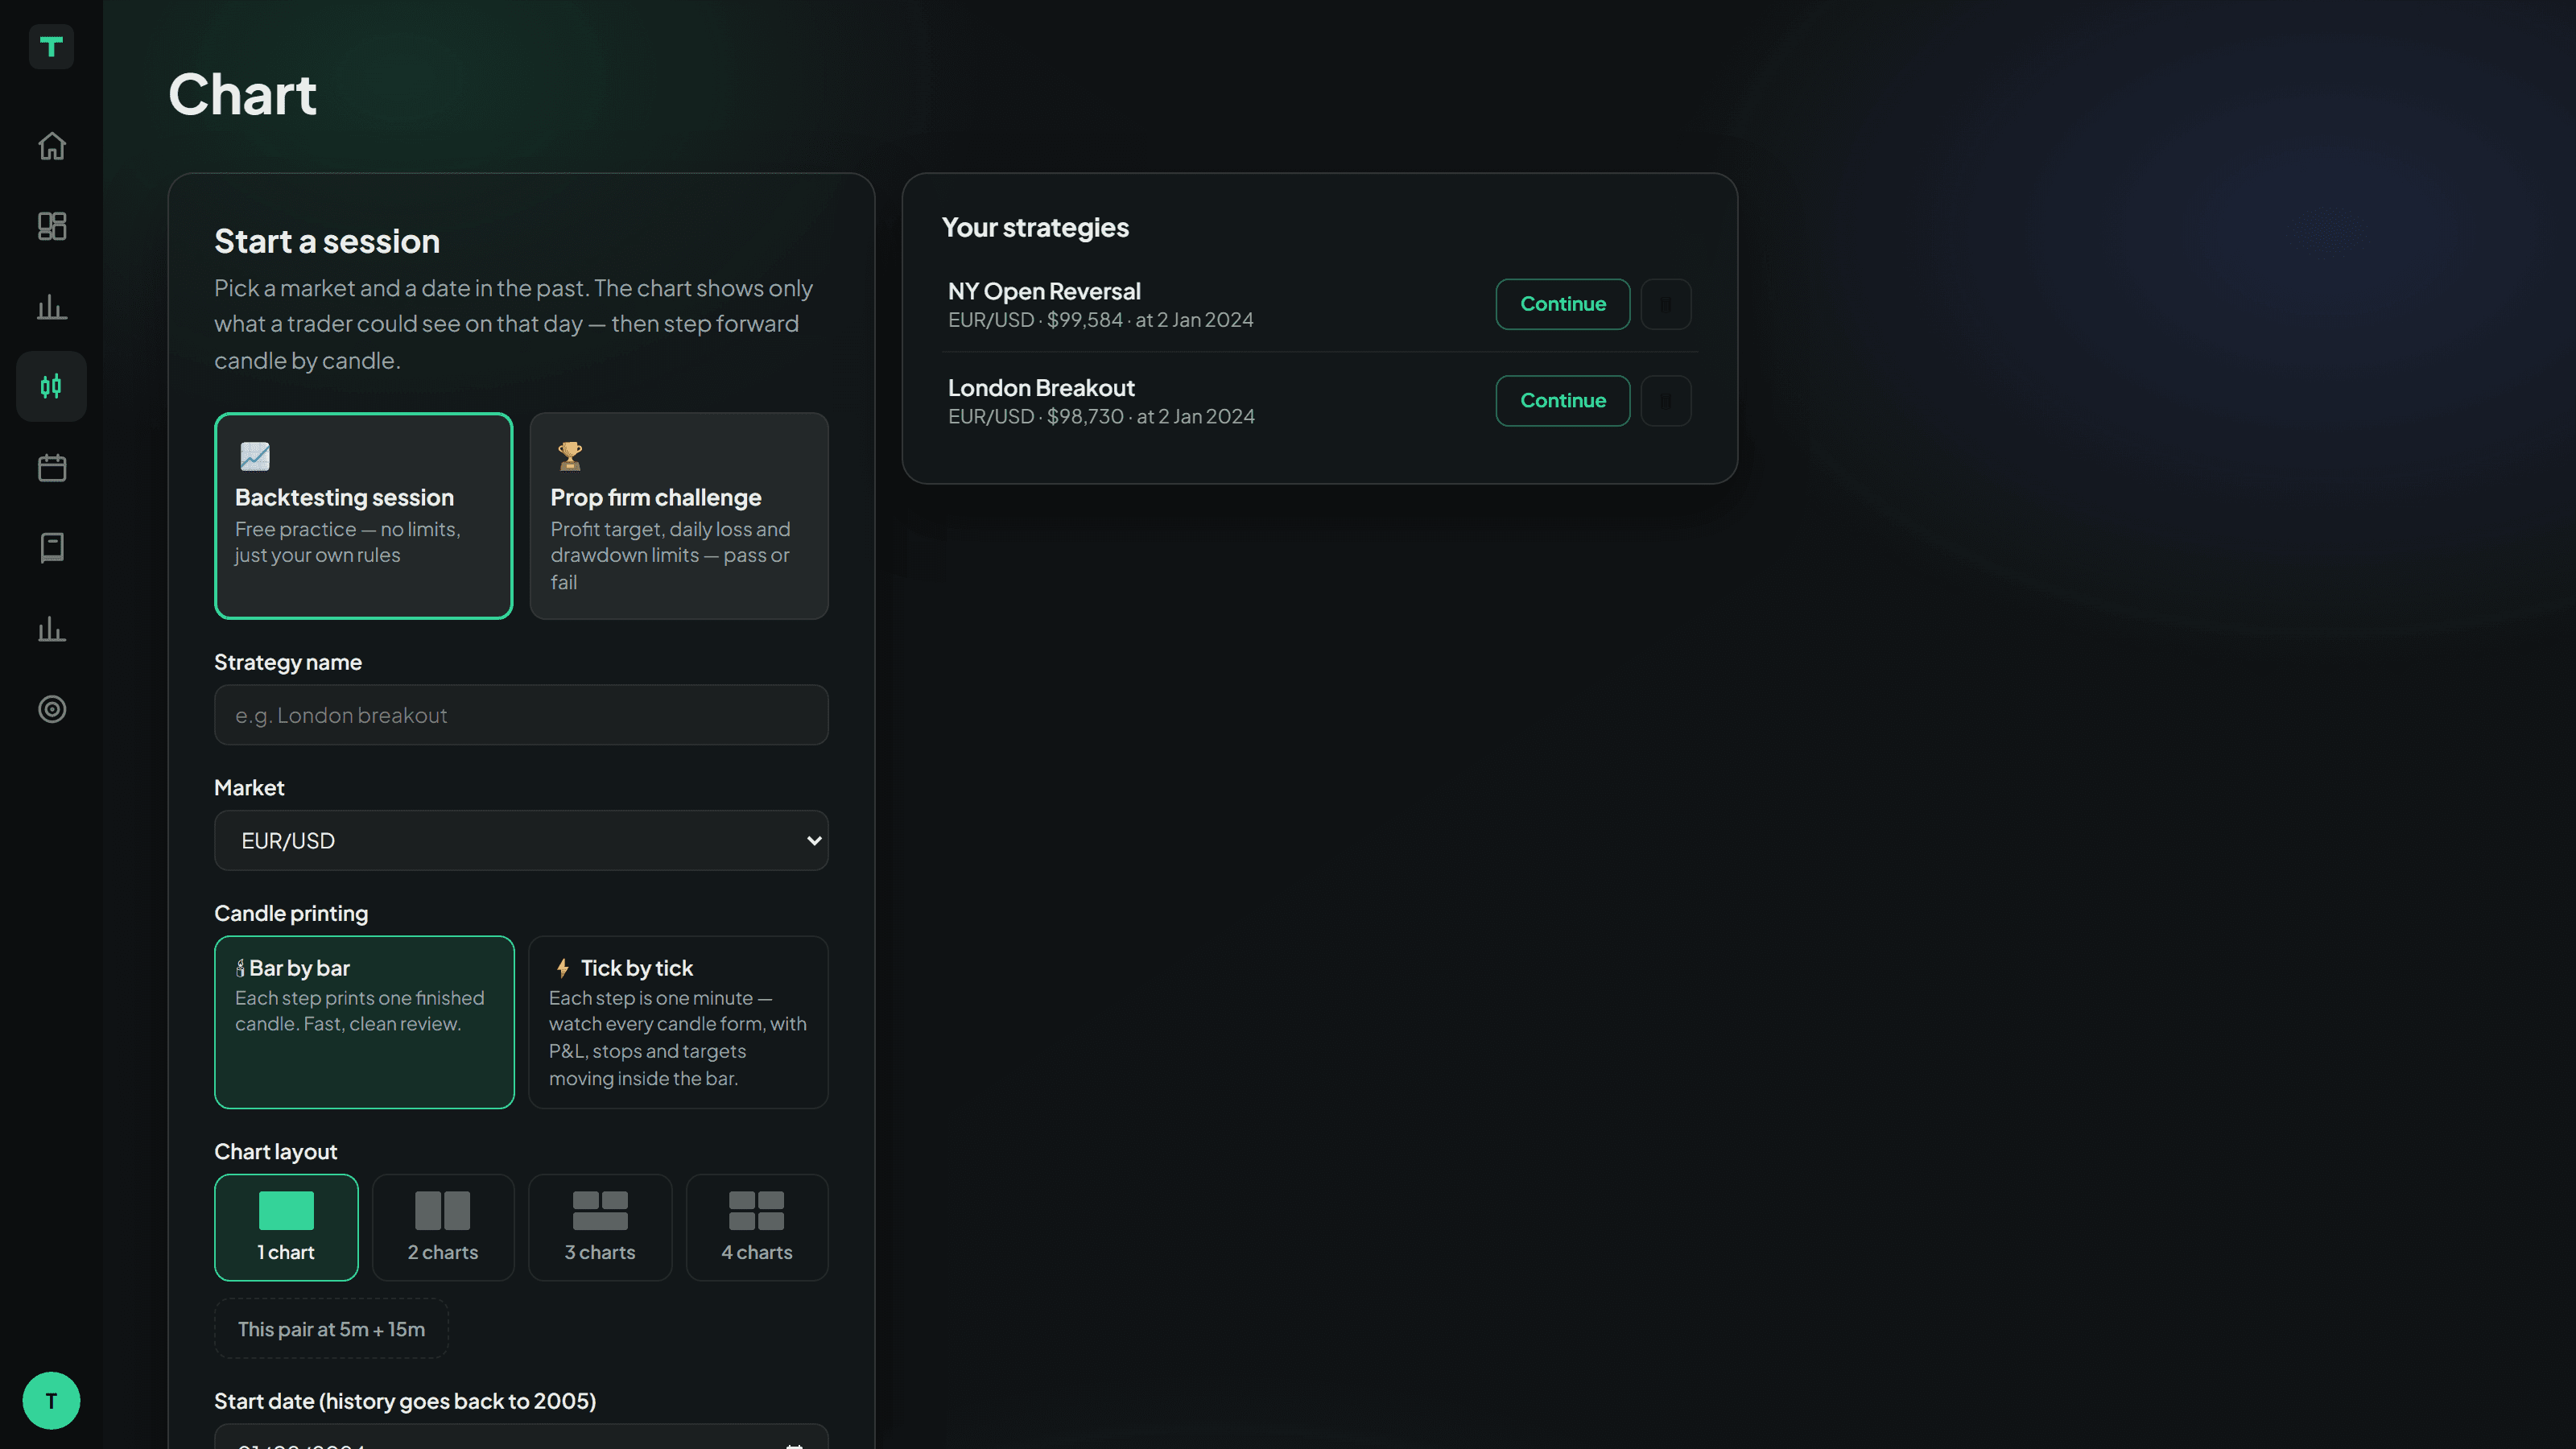
Click Chart in the left sidebar. This is where every session begins.
Choose a backtesting session
Leave Backtesting session selected. This is free practice with no pass or fail — the prop-firm option adds rules, and you can try that later.
Name your strategy
Type a name that describes what you are testing —
London Breakout, say, orGold scalp.This matters more than it looks. Every session, trade and statistic is grouped under this name, so you can compare one approach against another later. Use the same name each time you test the same idea.
Pick a market and a date
Choose a market from the dropdown — EUR/USD is a sensible first choice — then set a start date. History goes back to 2005 for the major currency pairs.
Pick a date you have not studied closely. The less you remember about what happened next, the more honest the test.
Set your starting balance
Use a number you would actually trade. If your real account is $5,000, testing with $100,000 teaches you nothing about how you size positions.
Press Start
The chart loads at your chosen moment with the future hidden.
Move forward
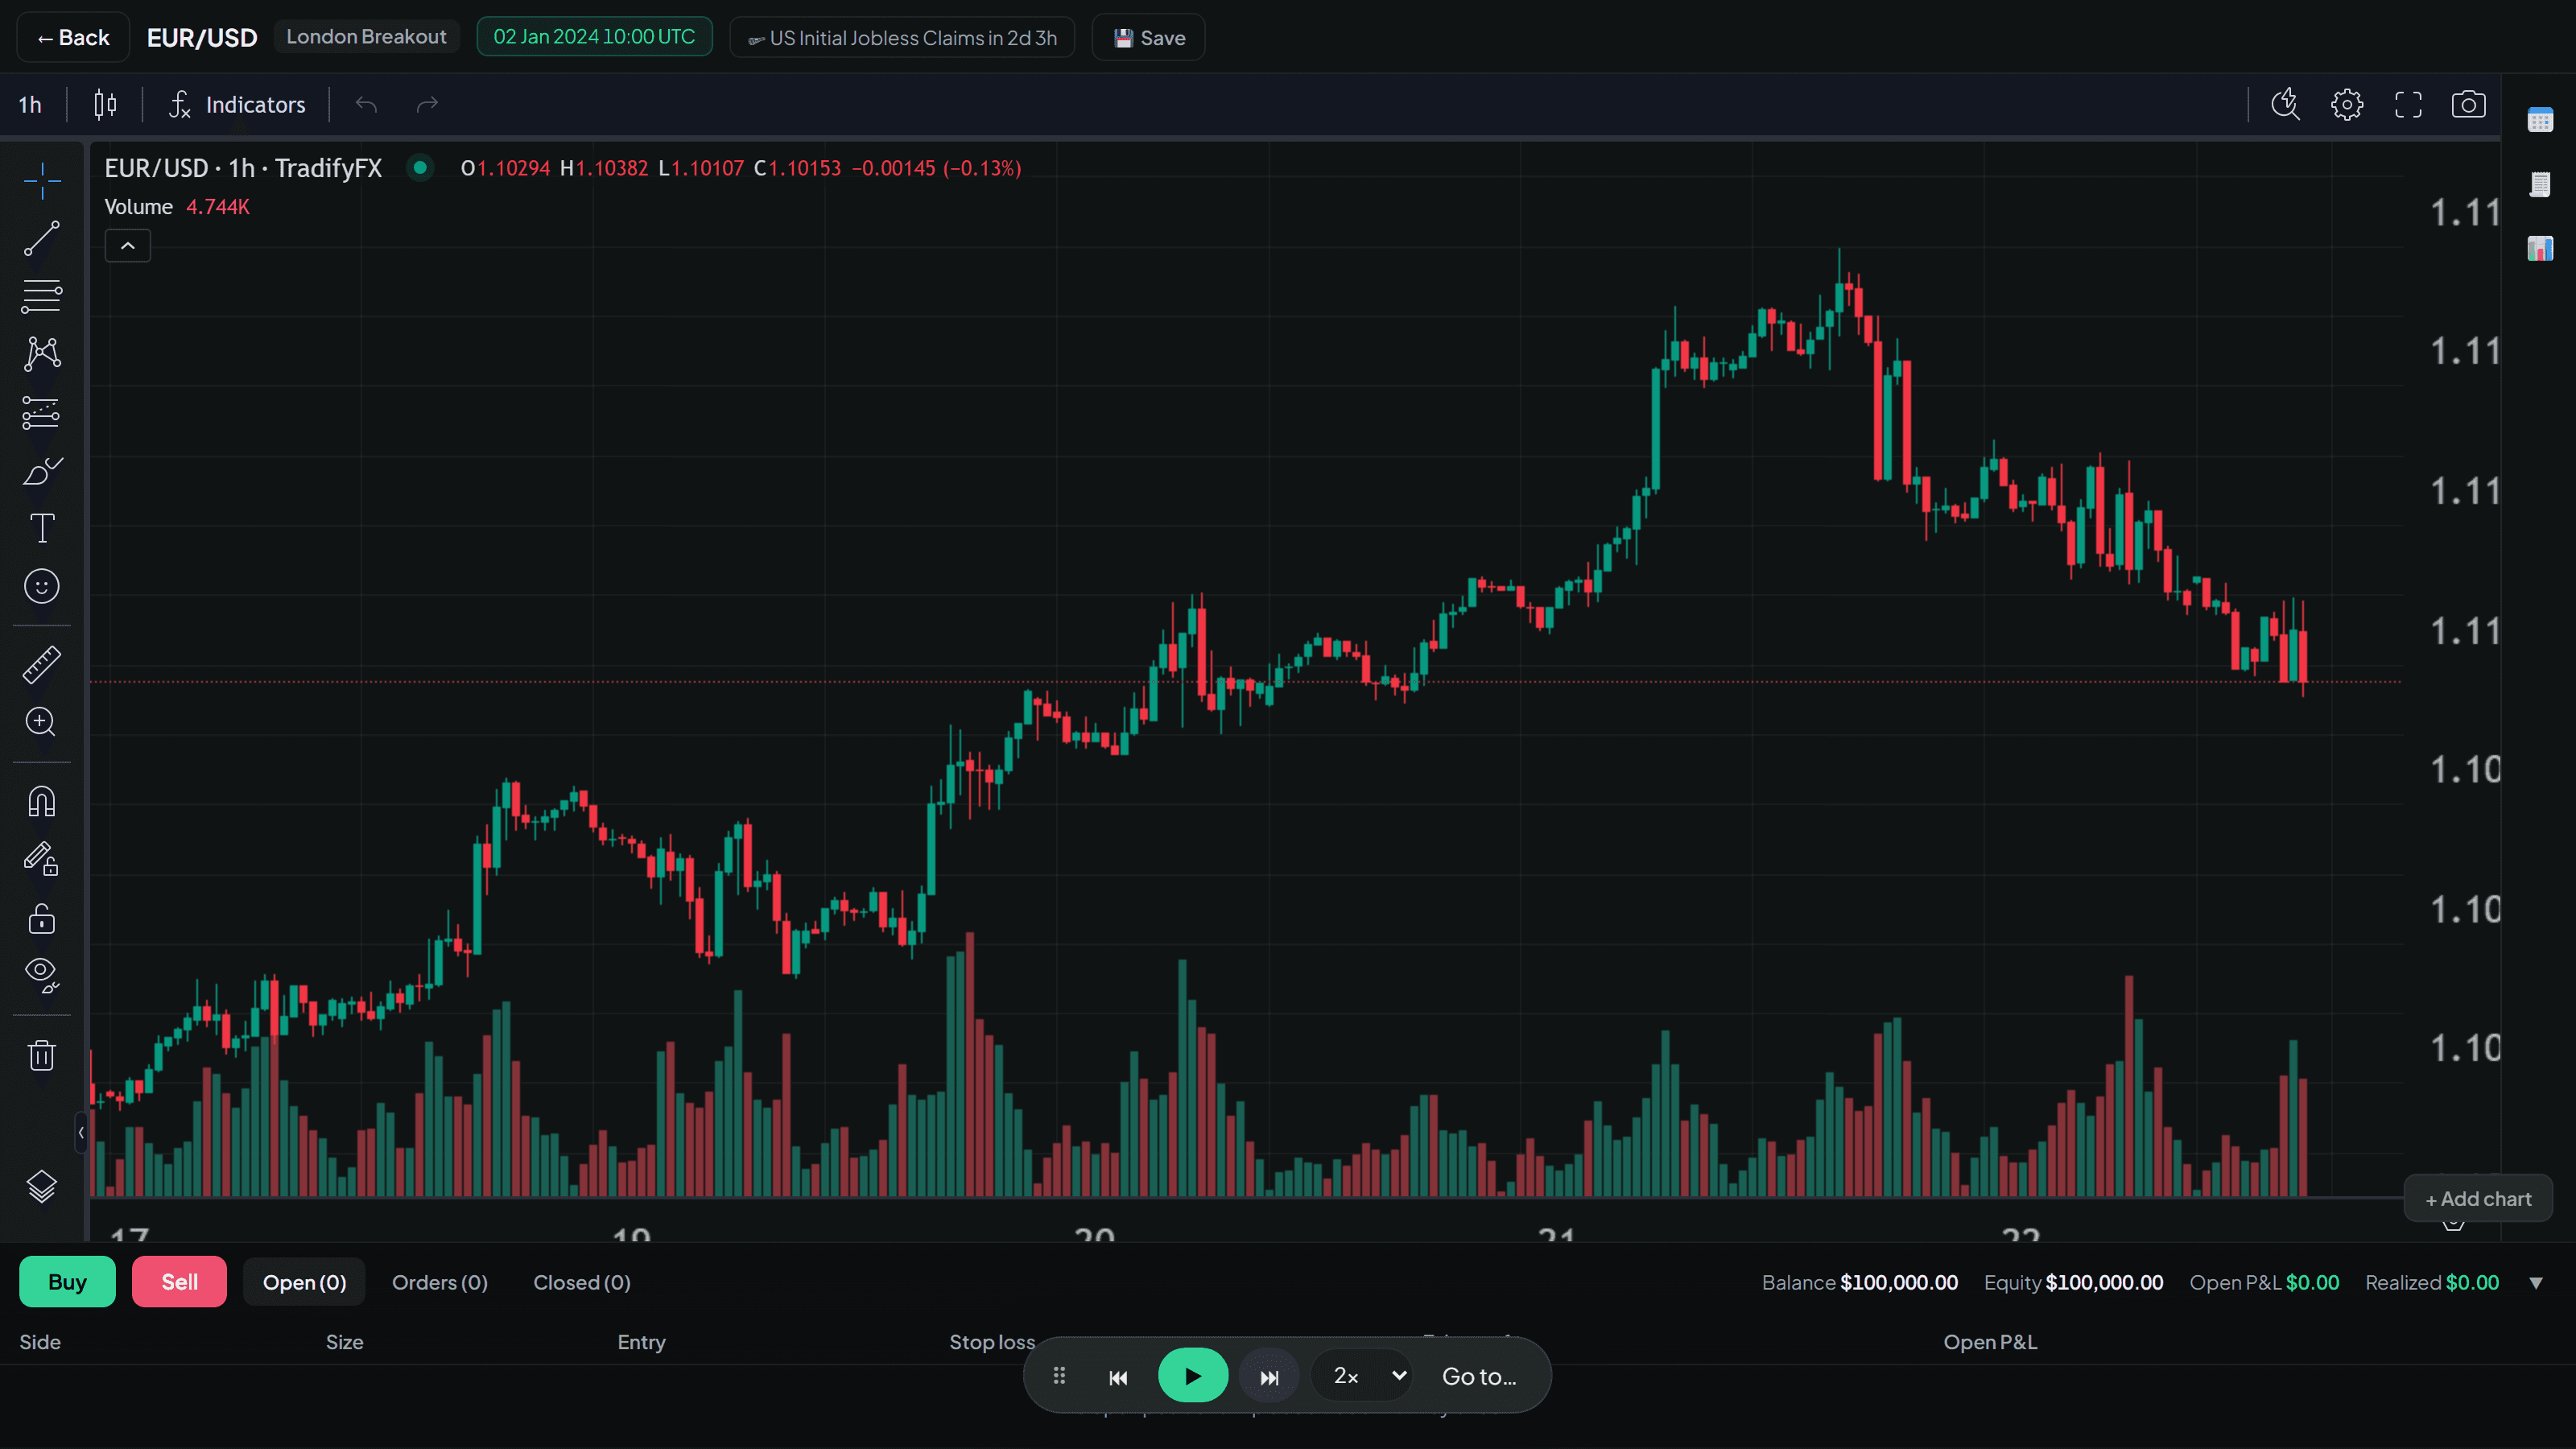
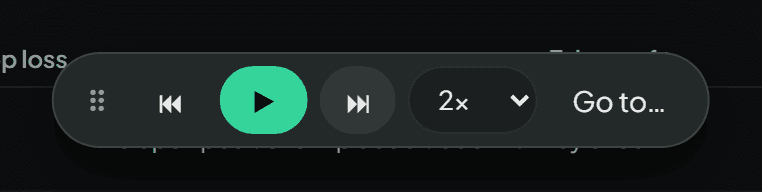
Use the floating controls at the bottom. Step forward prints one candle. Play runs continuously, and the speed dropdown goes up to 16x.
The clock in the top bar shows where you are in history.
Place a trade
When you see a setup you like, click Buy or Sell. The order ticket opens.
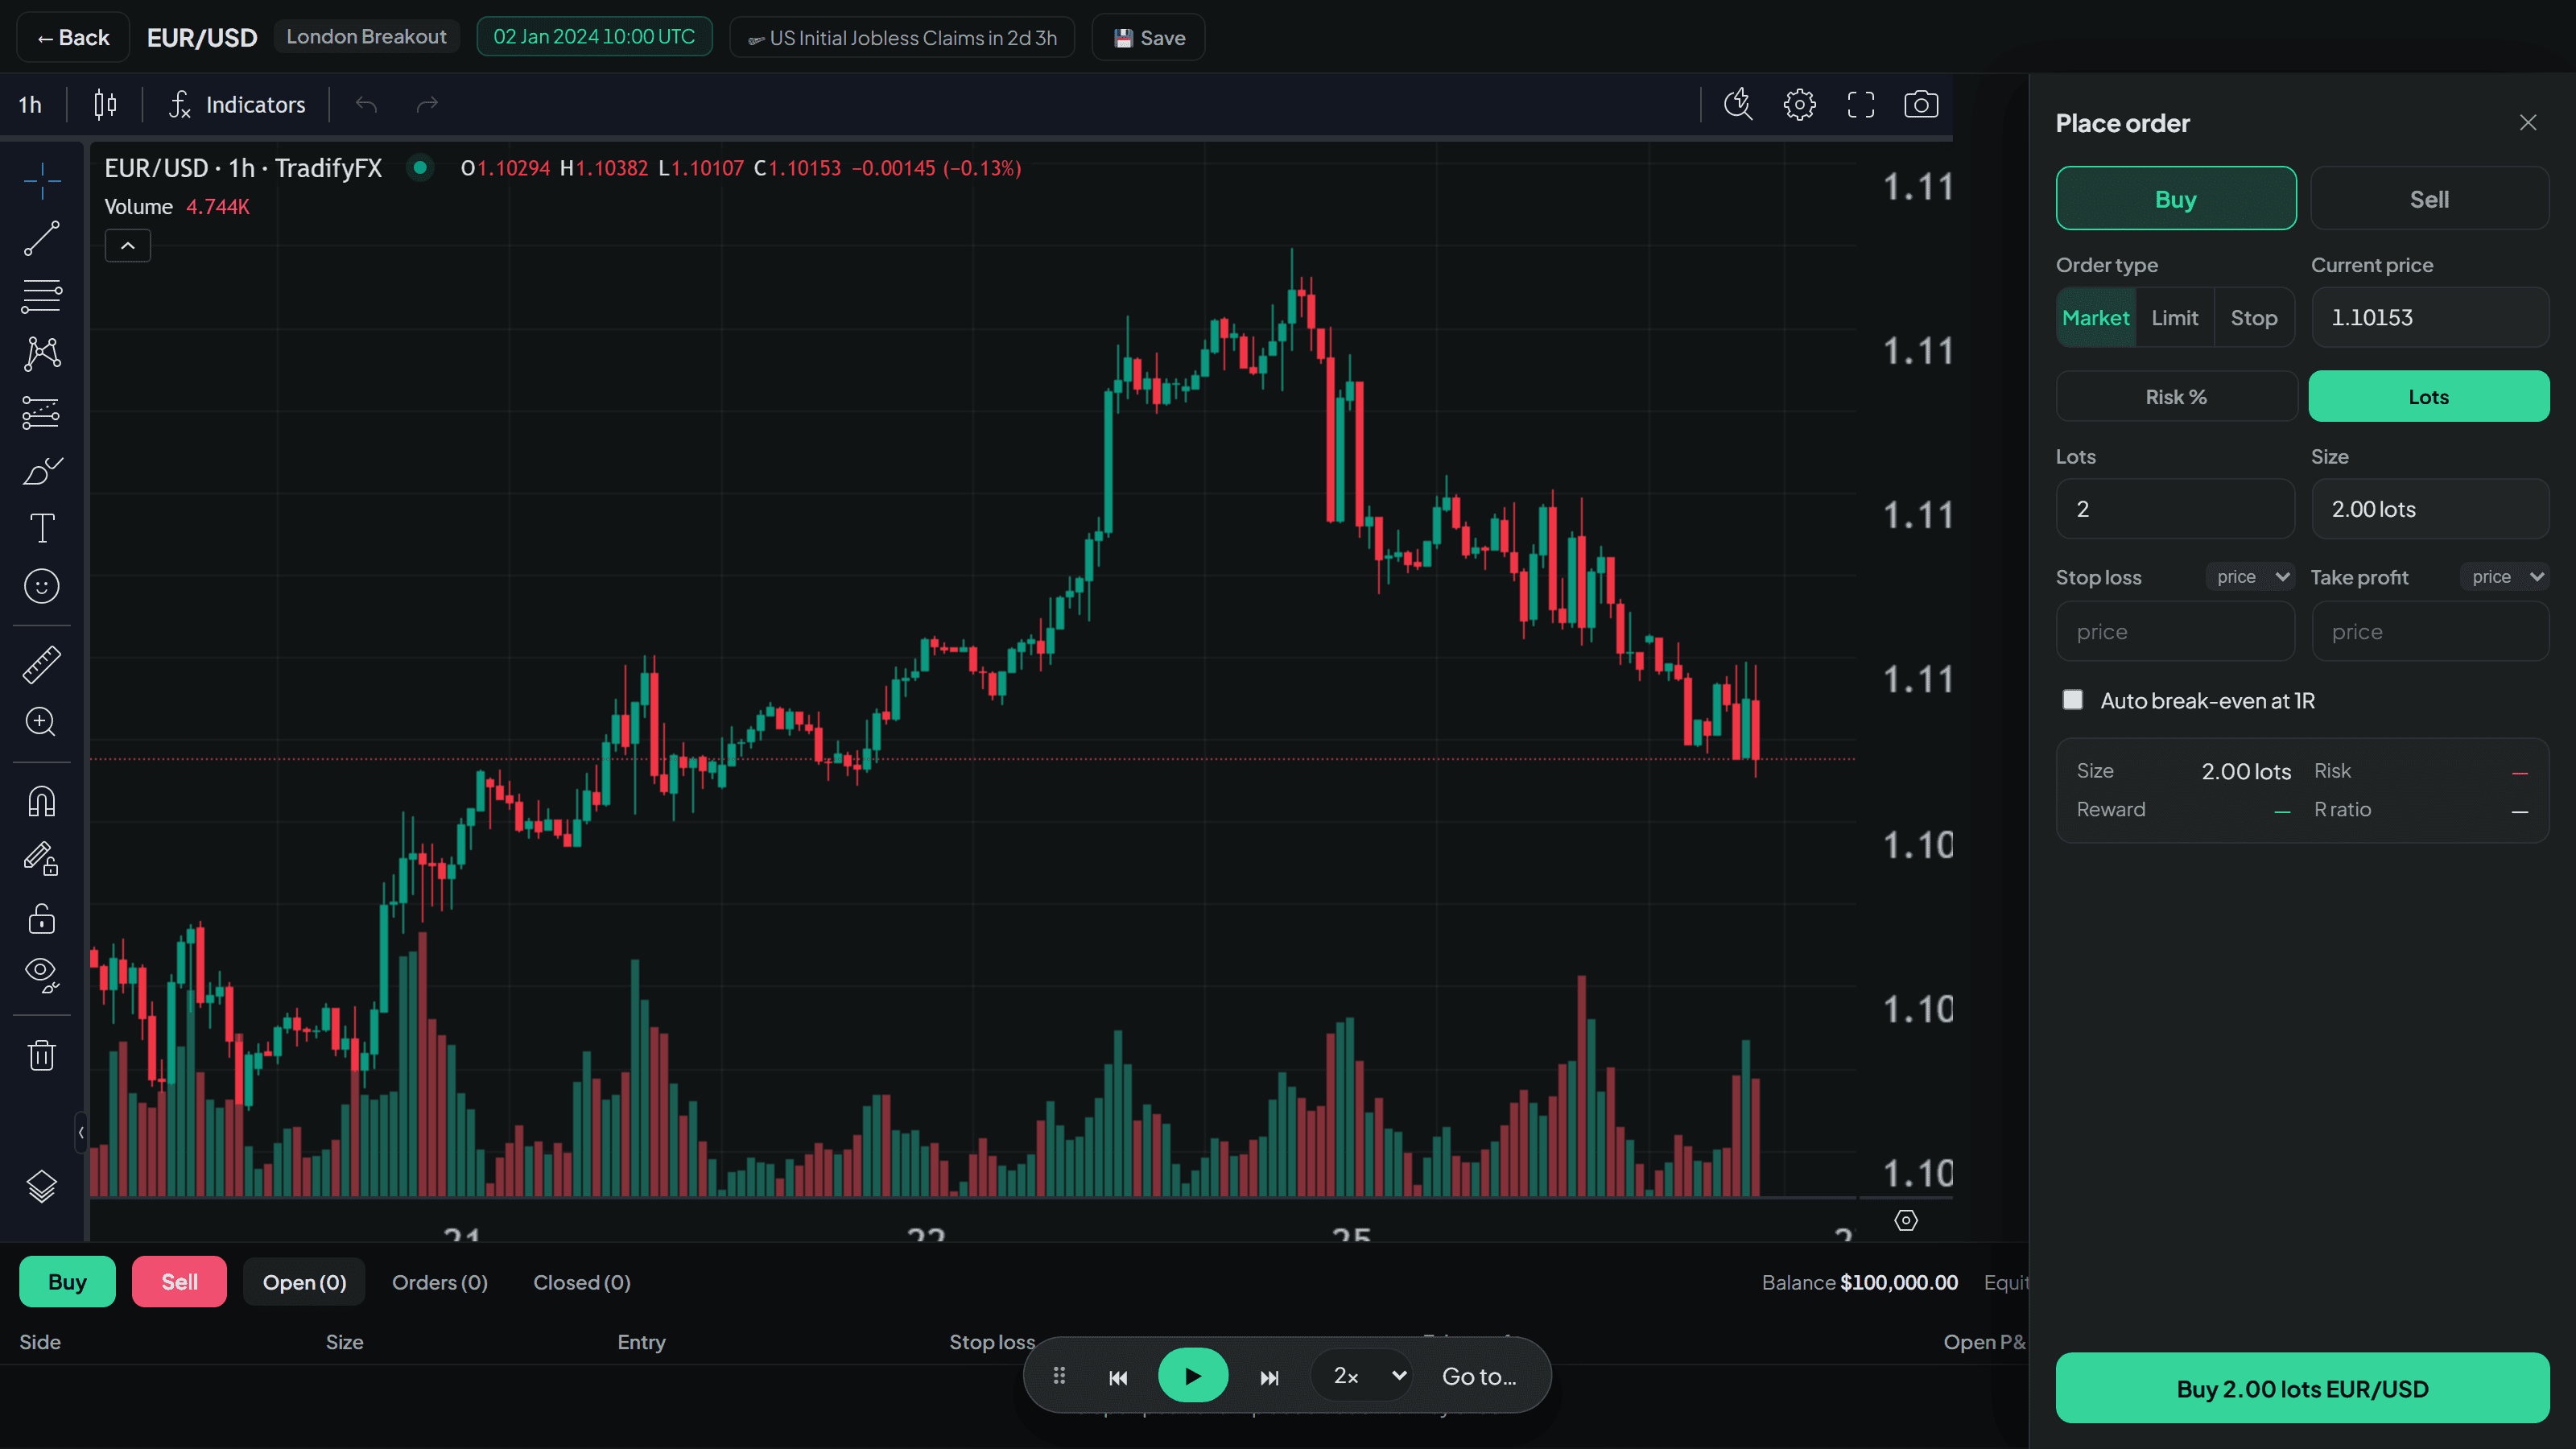
Set your size, add a stop loss and a take profit, then confirm. Your position appears on the chart and in the panel underneath.
Manage it
Keep stepping forward. Your profit and loss updates as each candle prints, and if price reaches your stop or your target the trade closes on its own — exactly as it would with a broker.
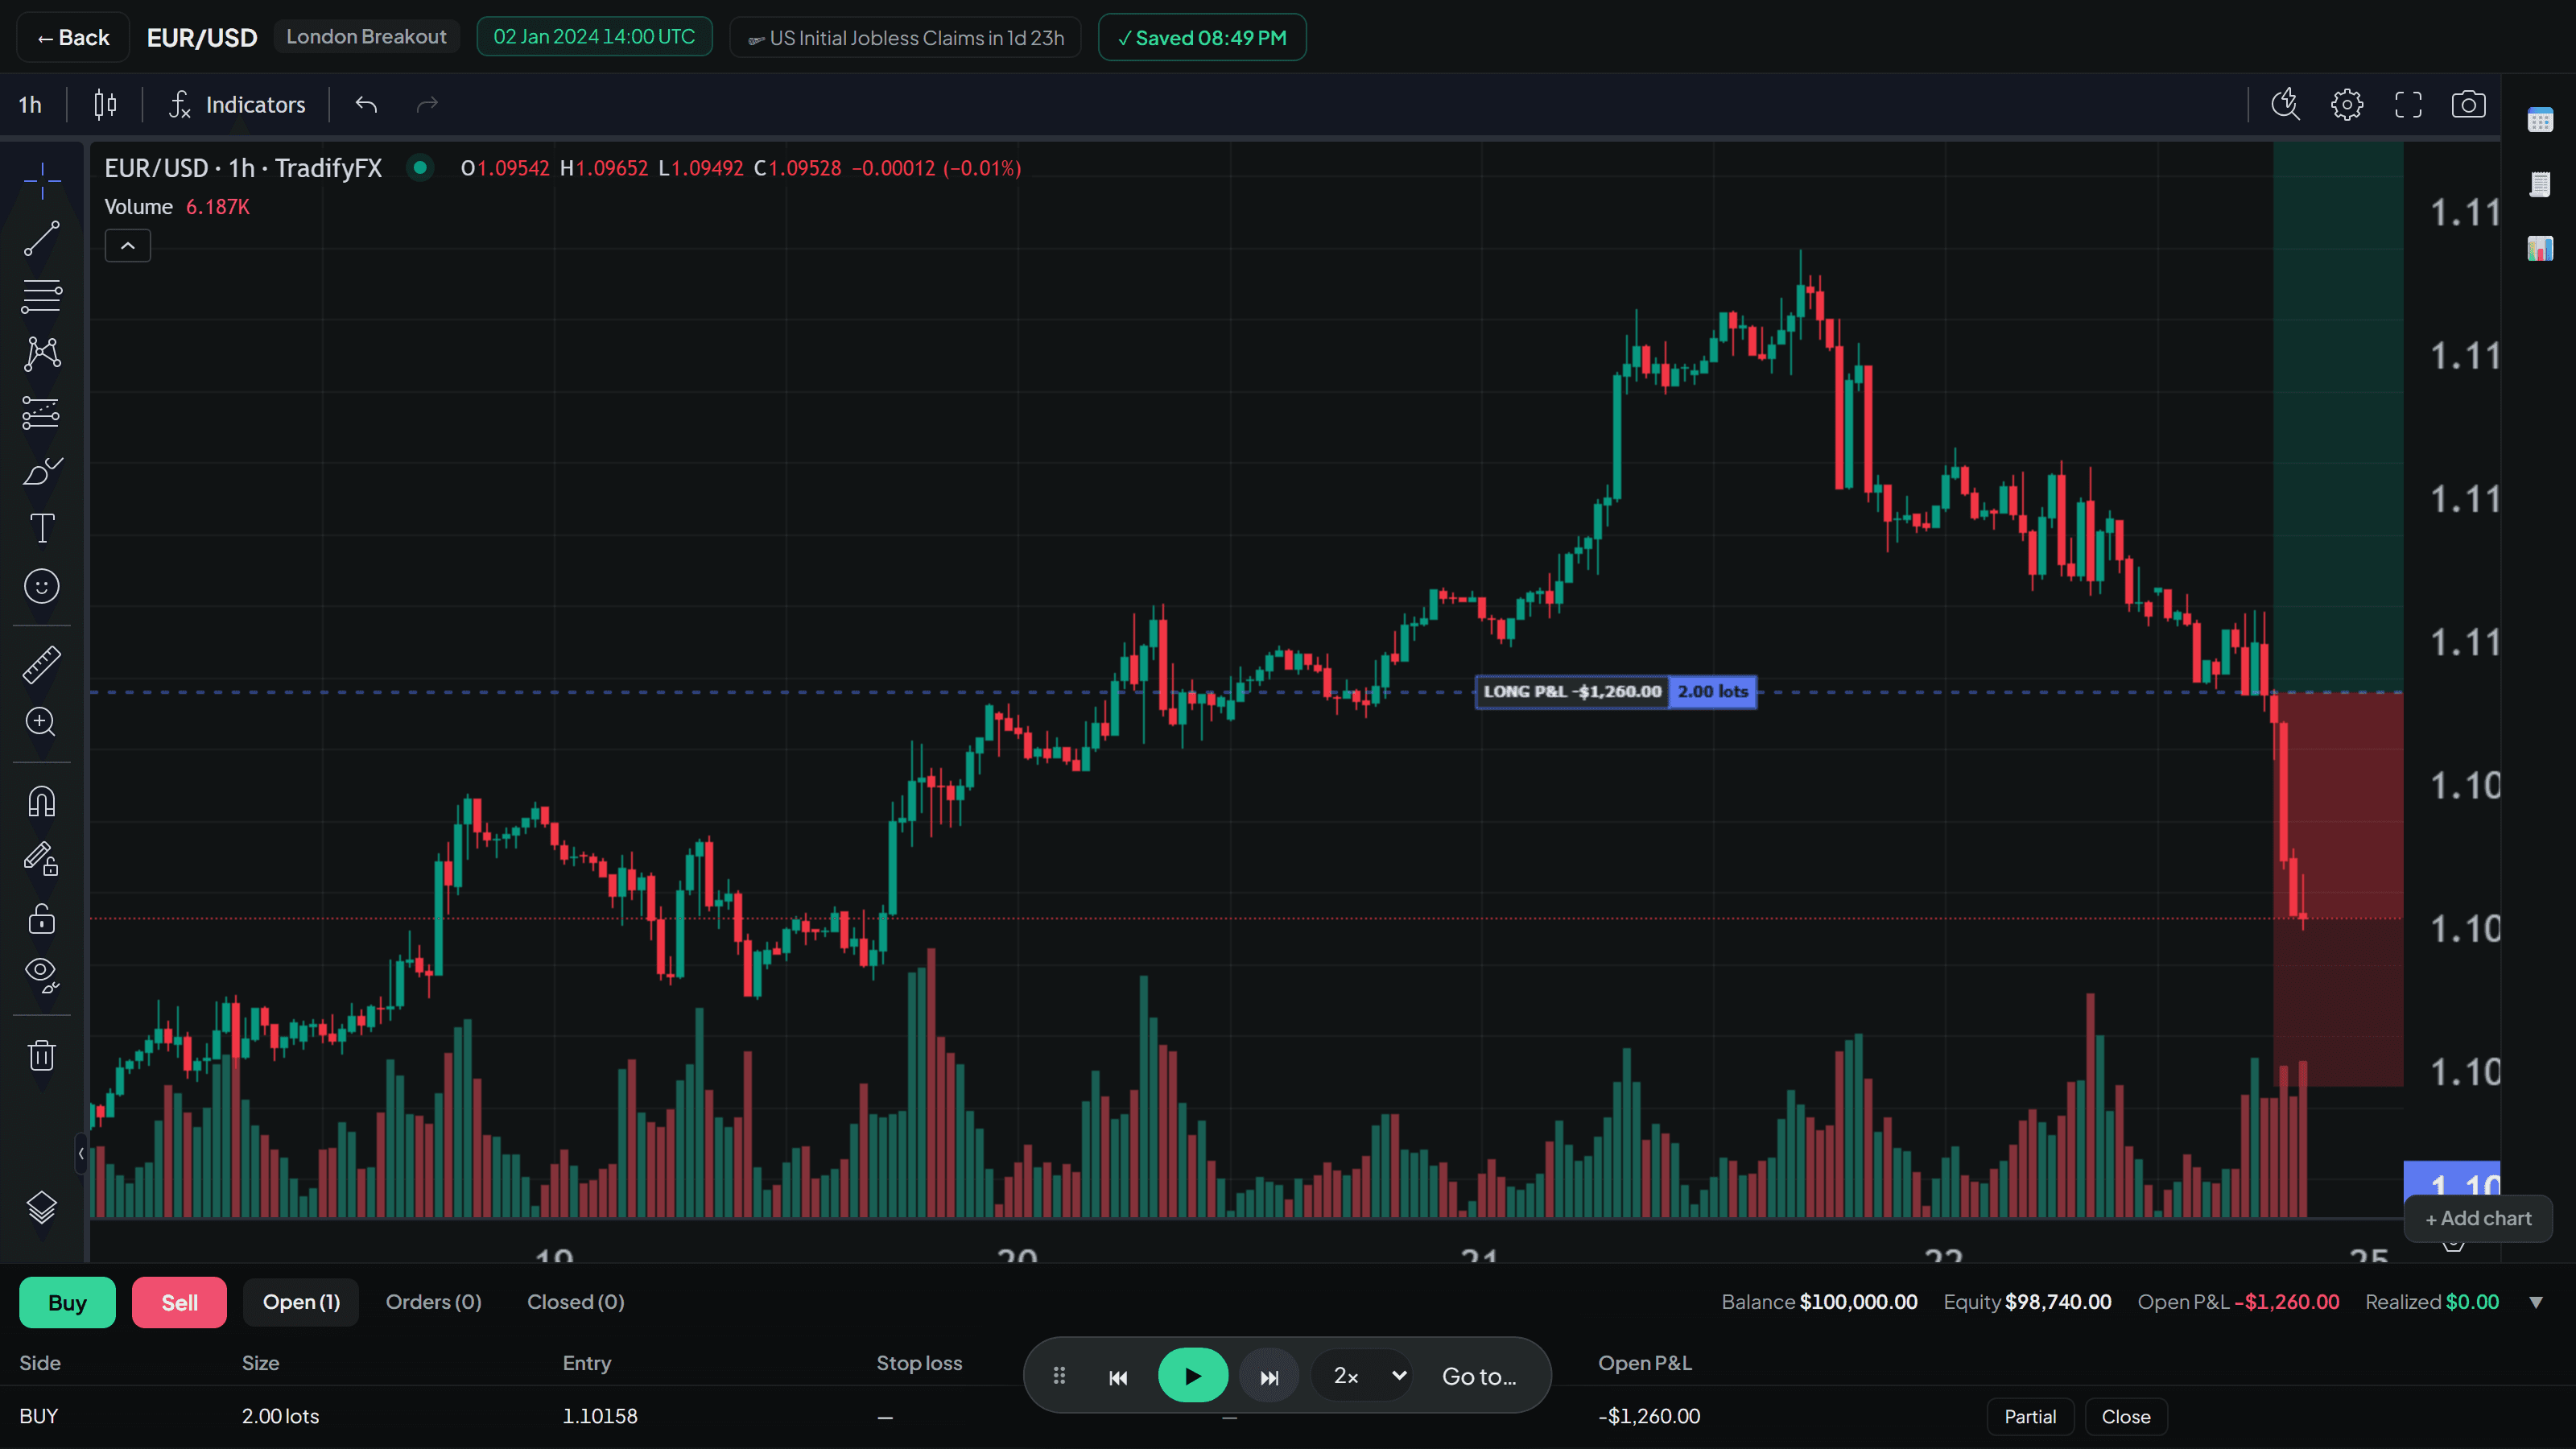
To close by hand, press Close in the positions panel.
End the session and read the summary
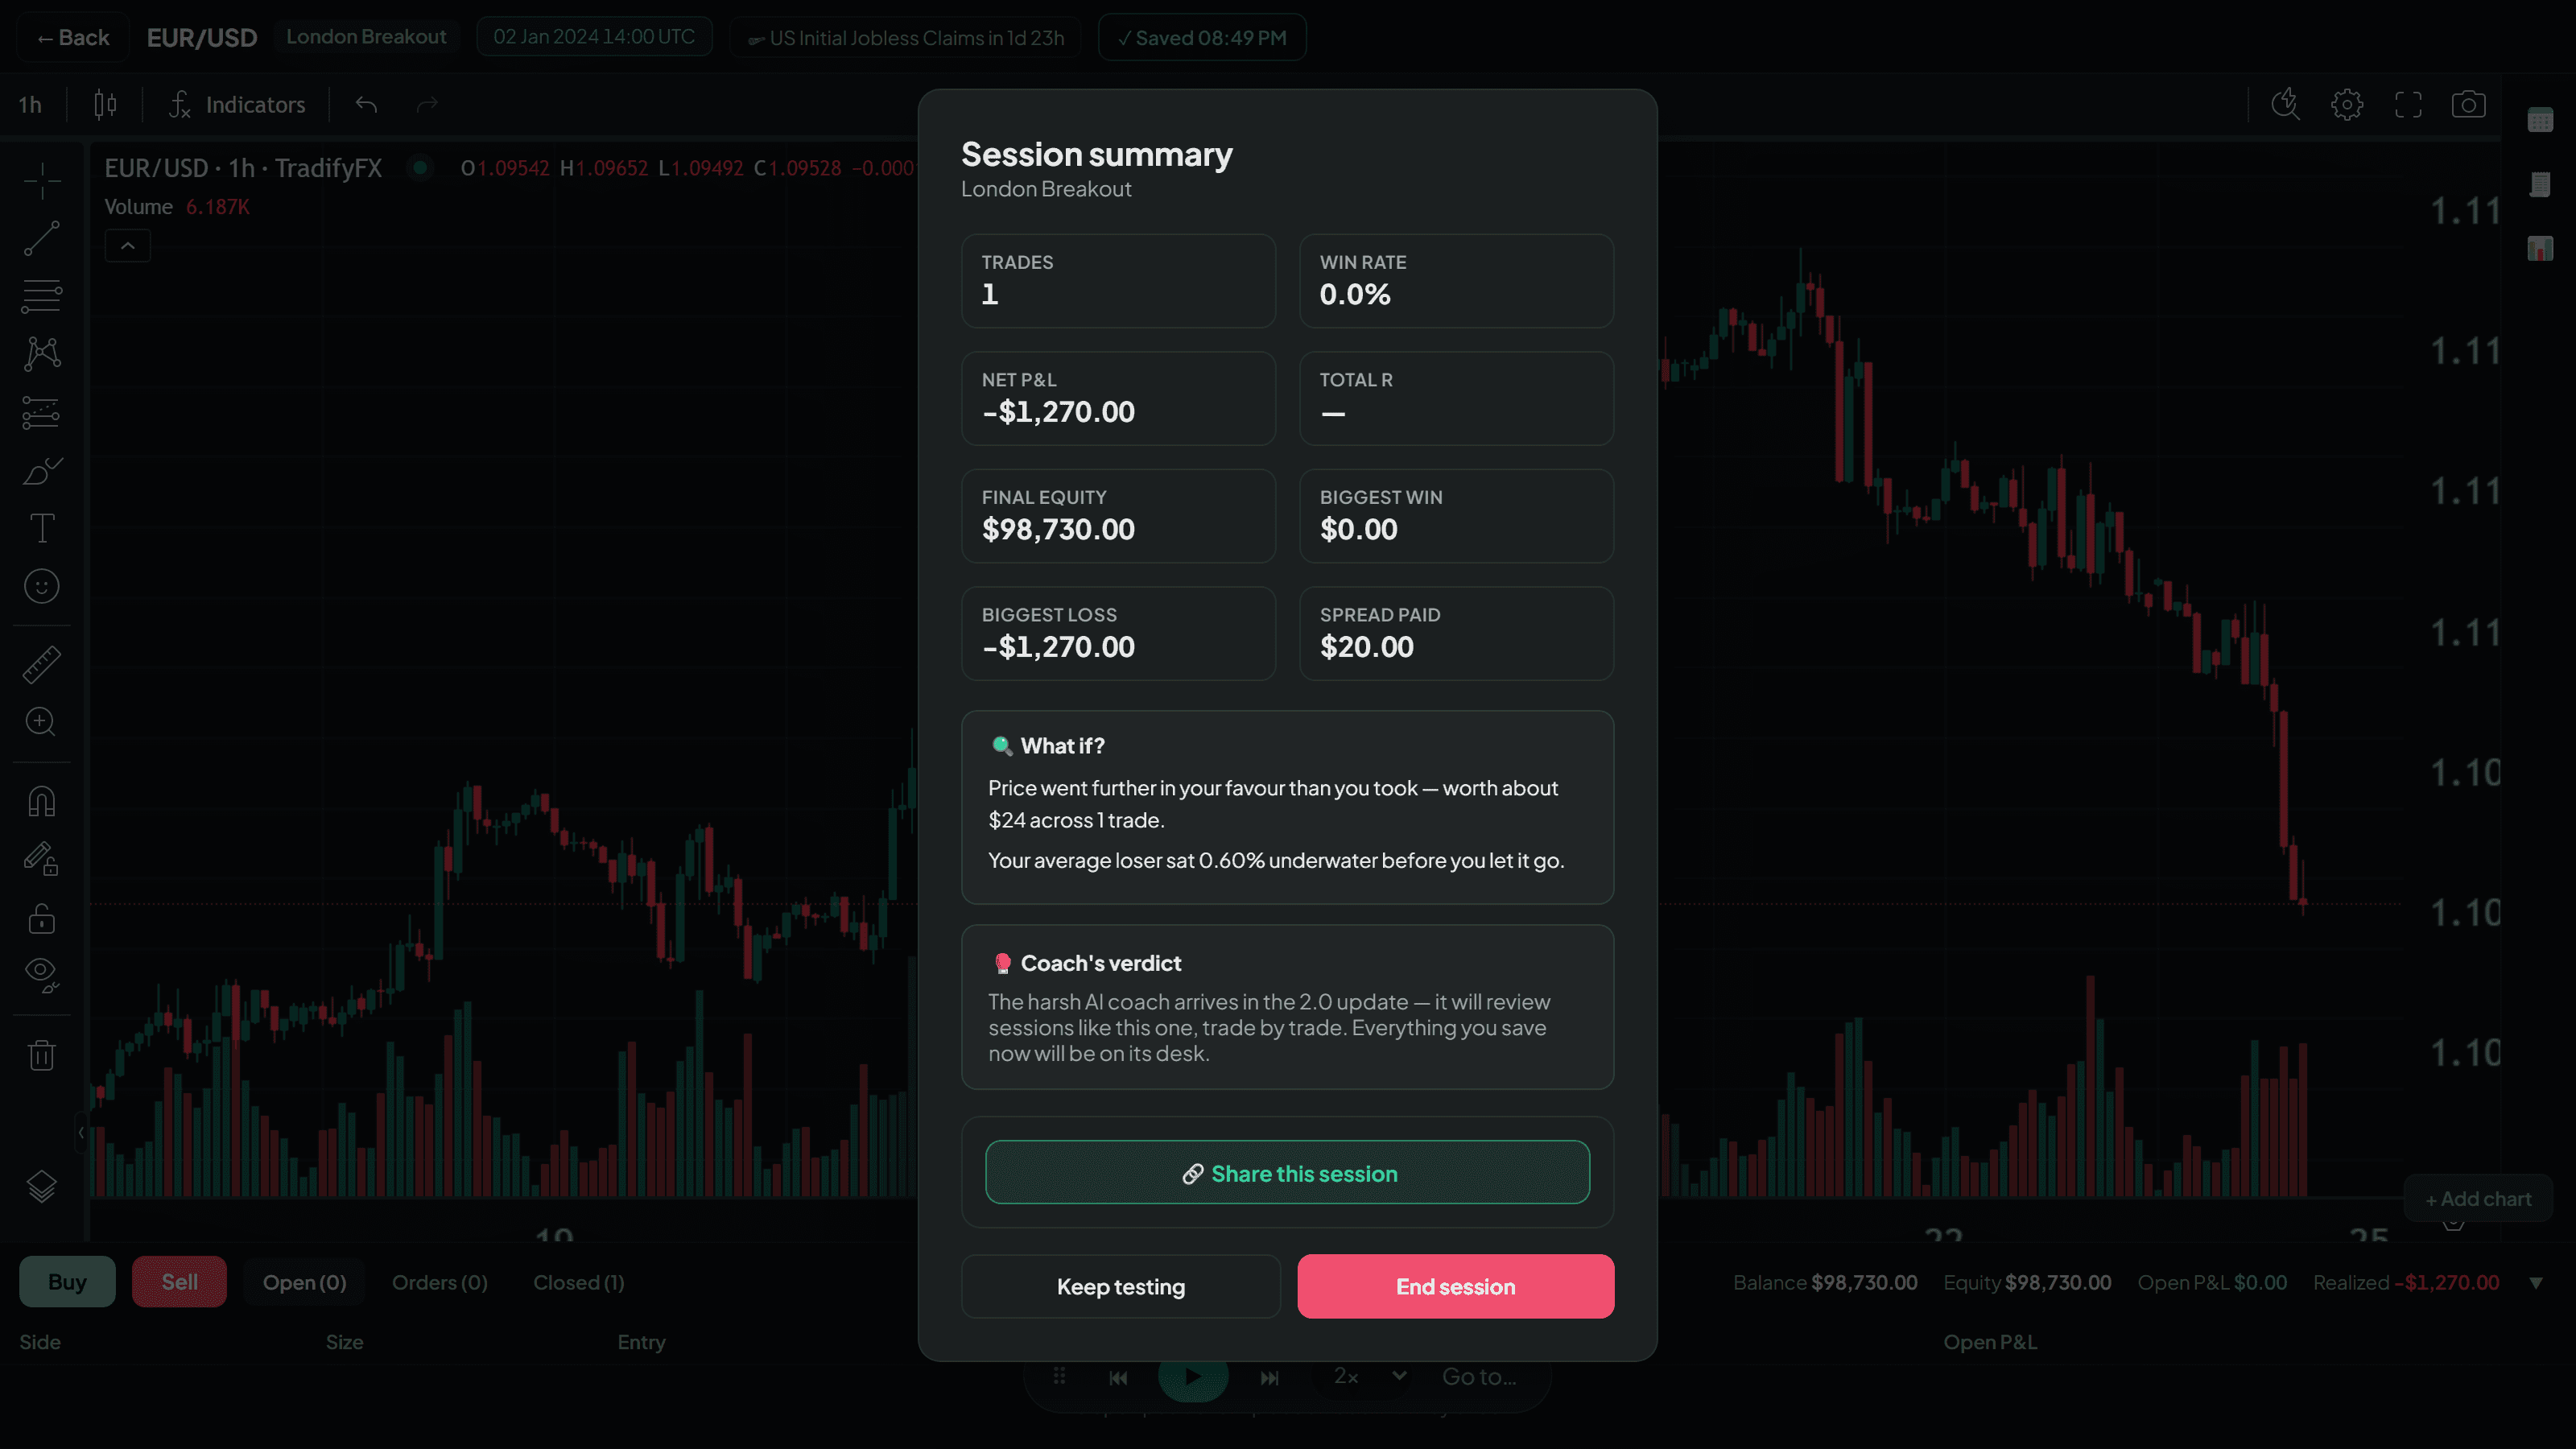
Press Back, then End session. You get a summary of what you just did — net result, win rate, and where you left money on the table.
What to do next
Your trades are now saved. Open the Journal to see them listed, or Analytics to see the numbers. They will look thin after one session — that is normal. The picture becomes useful somewhere around thirty trades.
Do the same test three times on three different dates before you judge a strategy. One session tells you almost nothing; three start to show a pattern.
Related articles
In this topic
Still stuck?
Tell us the strategy name and roughly when it happened, and we’ll look at the exact session.
Contact support


