
TF
TradifyFX Team
·
1
min read
Twenty-two widgets you arrange however you like.
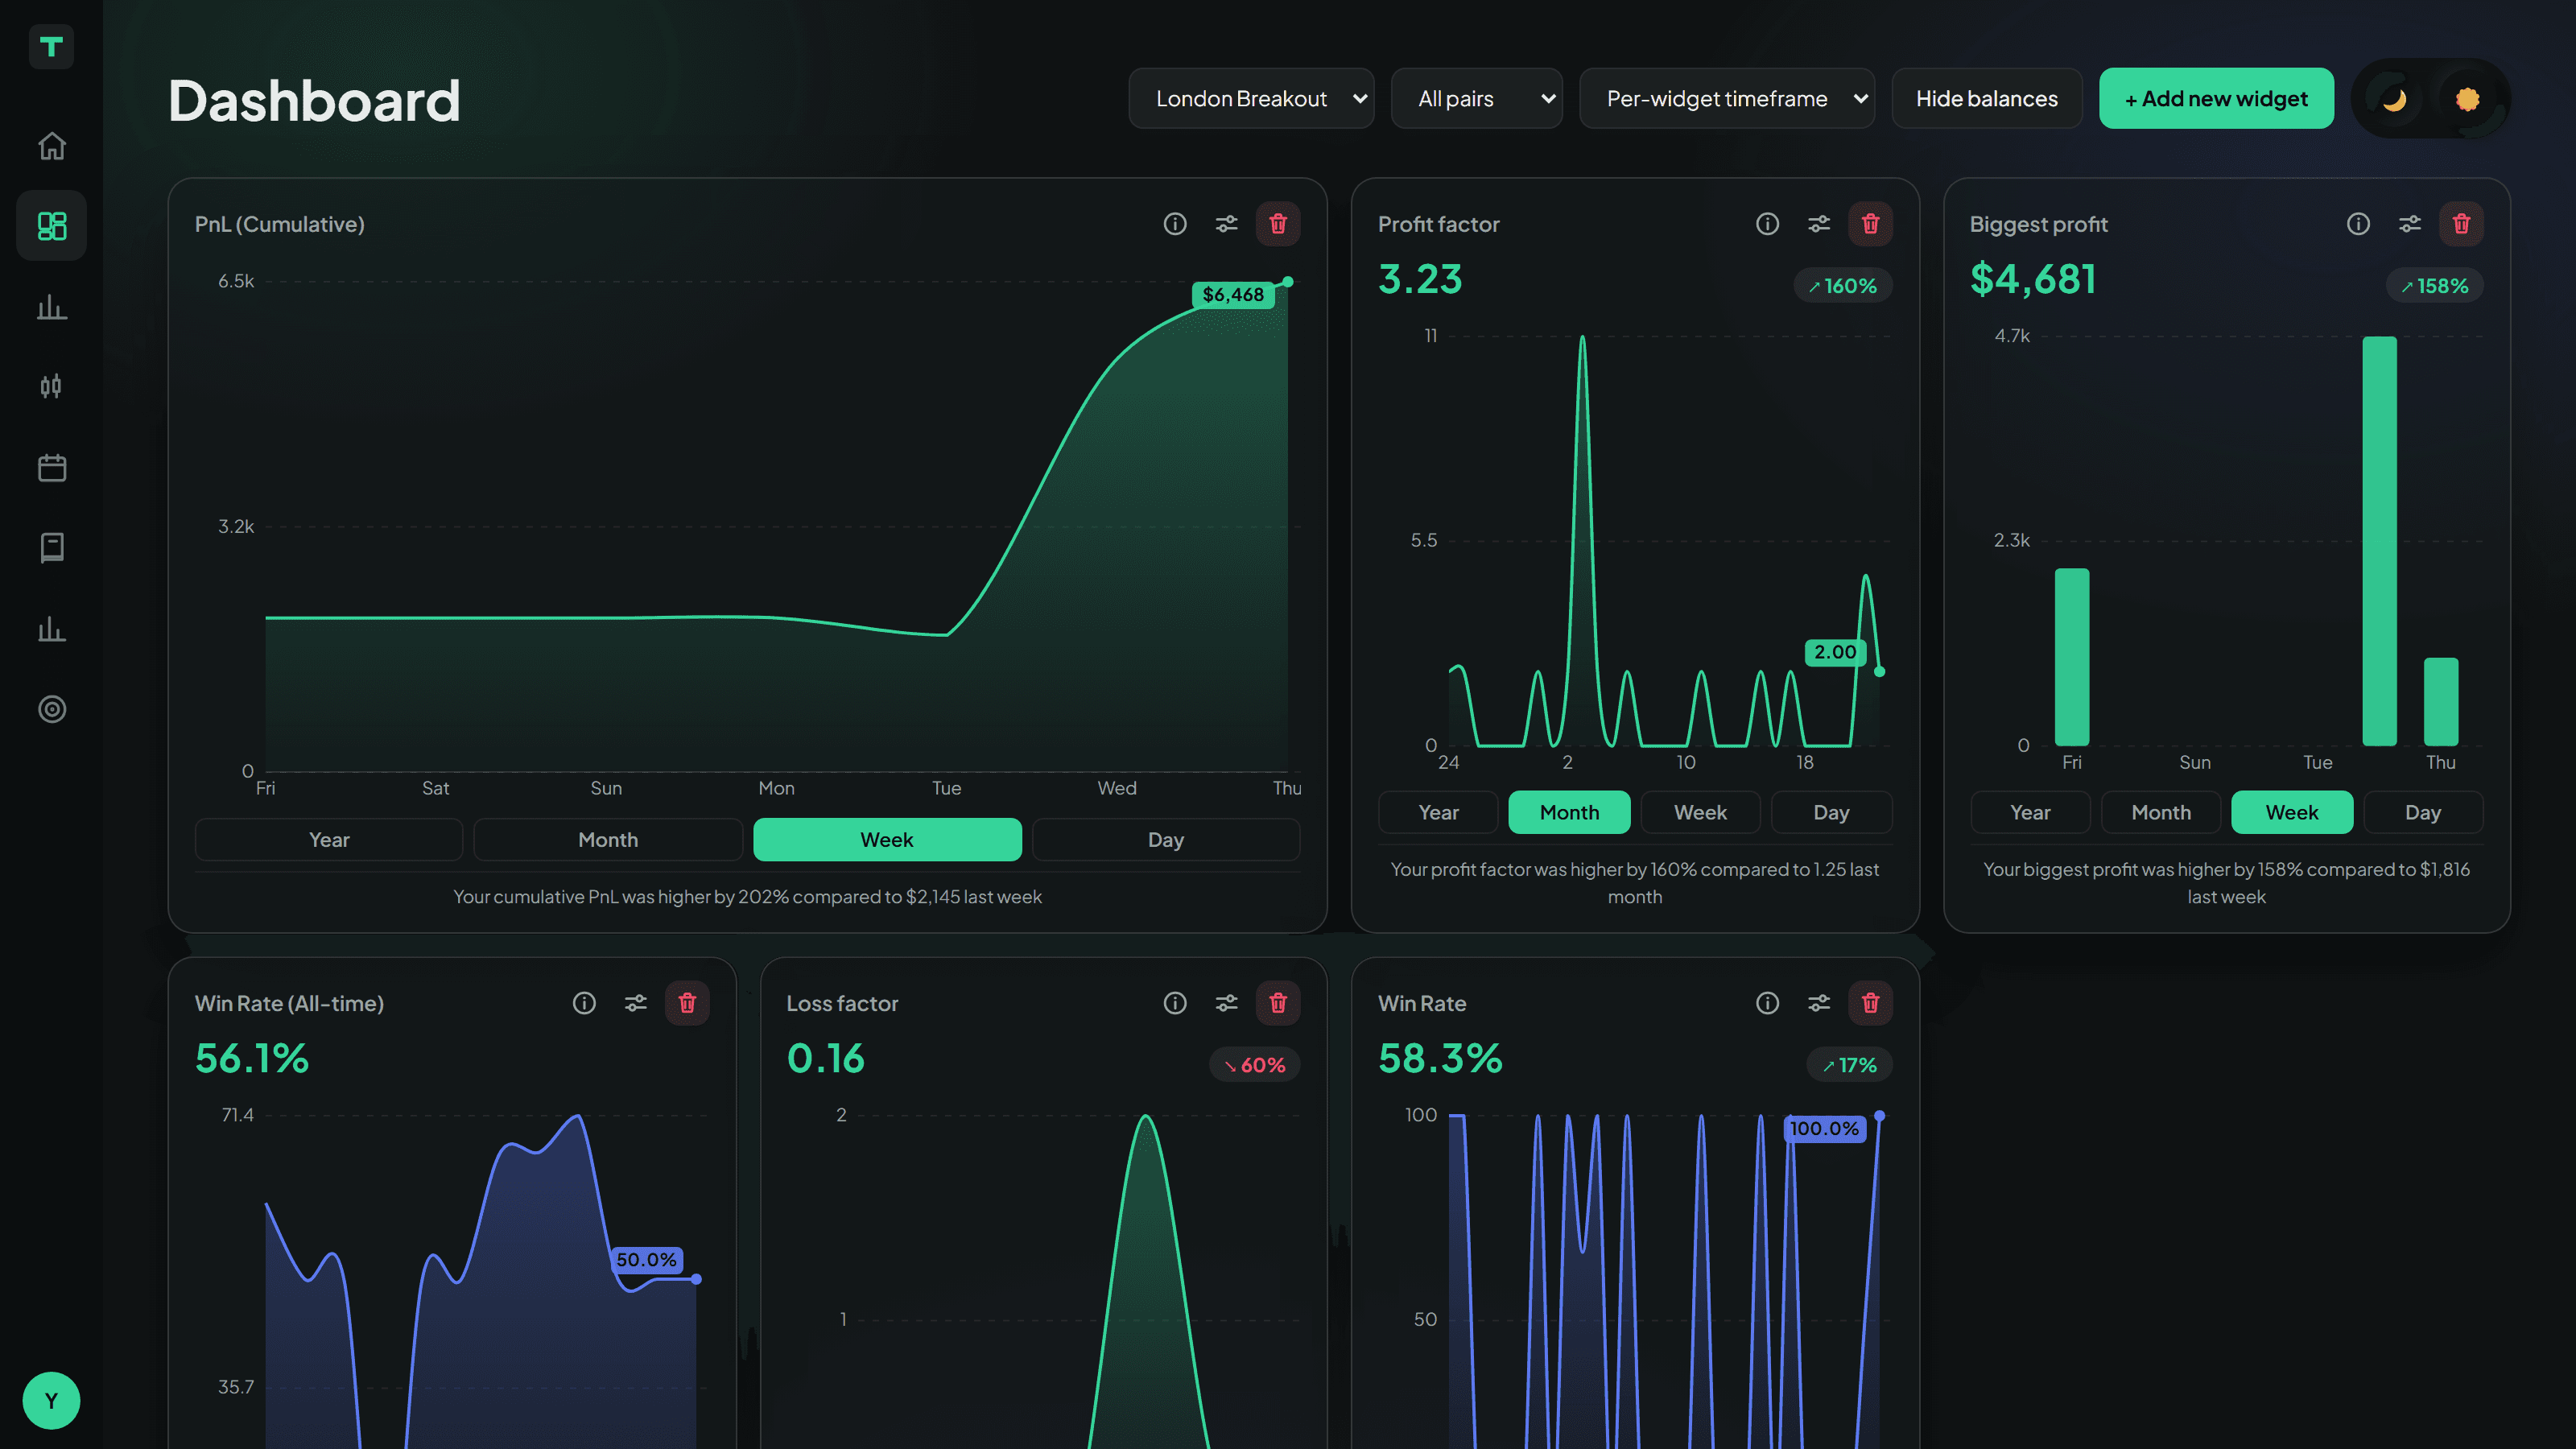
The dashboard is yours to build — pick the numbers you care about and drop the rest.
Adding widgets
Add widget opens a list of 22, each with a preview. Anything already on your dashboard is marked so you do not add it twice.
They cover results (net P&L, win rate, profit factor, expectancy, biggest win and loss), risk (max drawdown, average position size), behaviour (win and loss streaks, hold-time ratio, green days) and activity (trade count, volume, average trade size).
Sizes and arrangement
Each widget can be small, medium or large — small for a single figure, larger to include a chart. Drag any card to reorder, and your layout is saved to your account.
Timeframes
Set a period for the whole dashboard from the top bar, or give an individual widget its own. Most cards also show a comparison against the previous period in plain English.
Hide balances
Blurs every money figure — for screen sharing, or for recording a video without showing your account size.
Periods are measured from your last trade, not from today. If you spent tonight replaying March 2024, “this week” means the week around those trades. Otherwise every window would read zero, which is what you would get from a calendar that only knows real time.
Related articles
In this topic
Still stuck?
Tell us the strategy name and roughly when it happened, and we’ll look at the exact session.
Contact support


