
TF
TradifyFX Team
·
2
min read
What every part of the replay screen does.
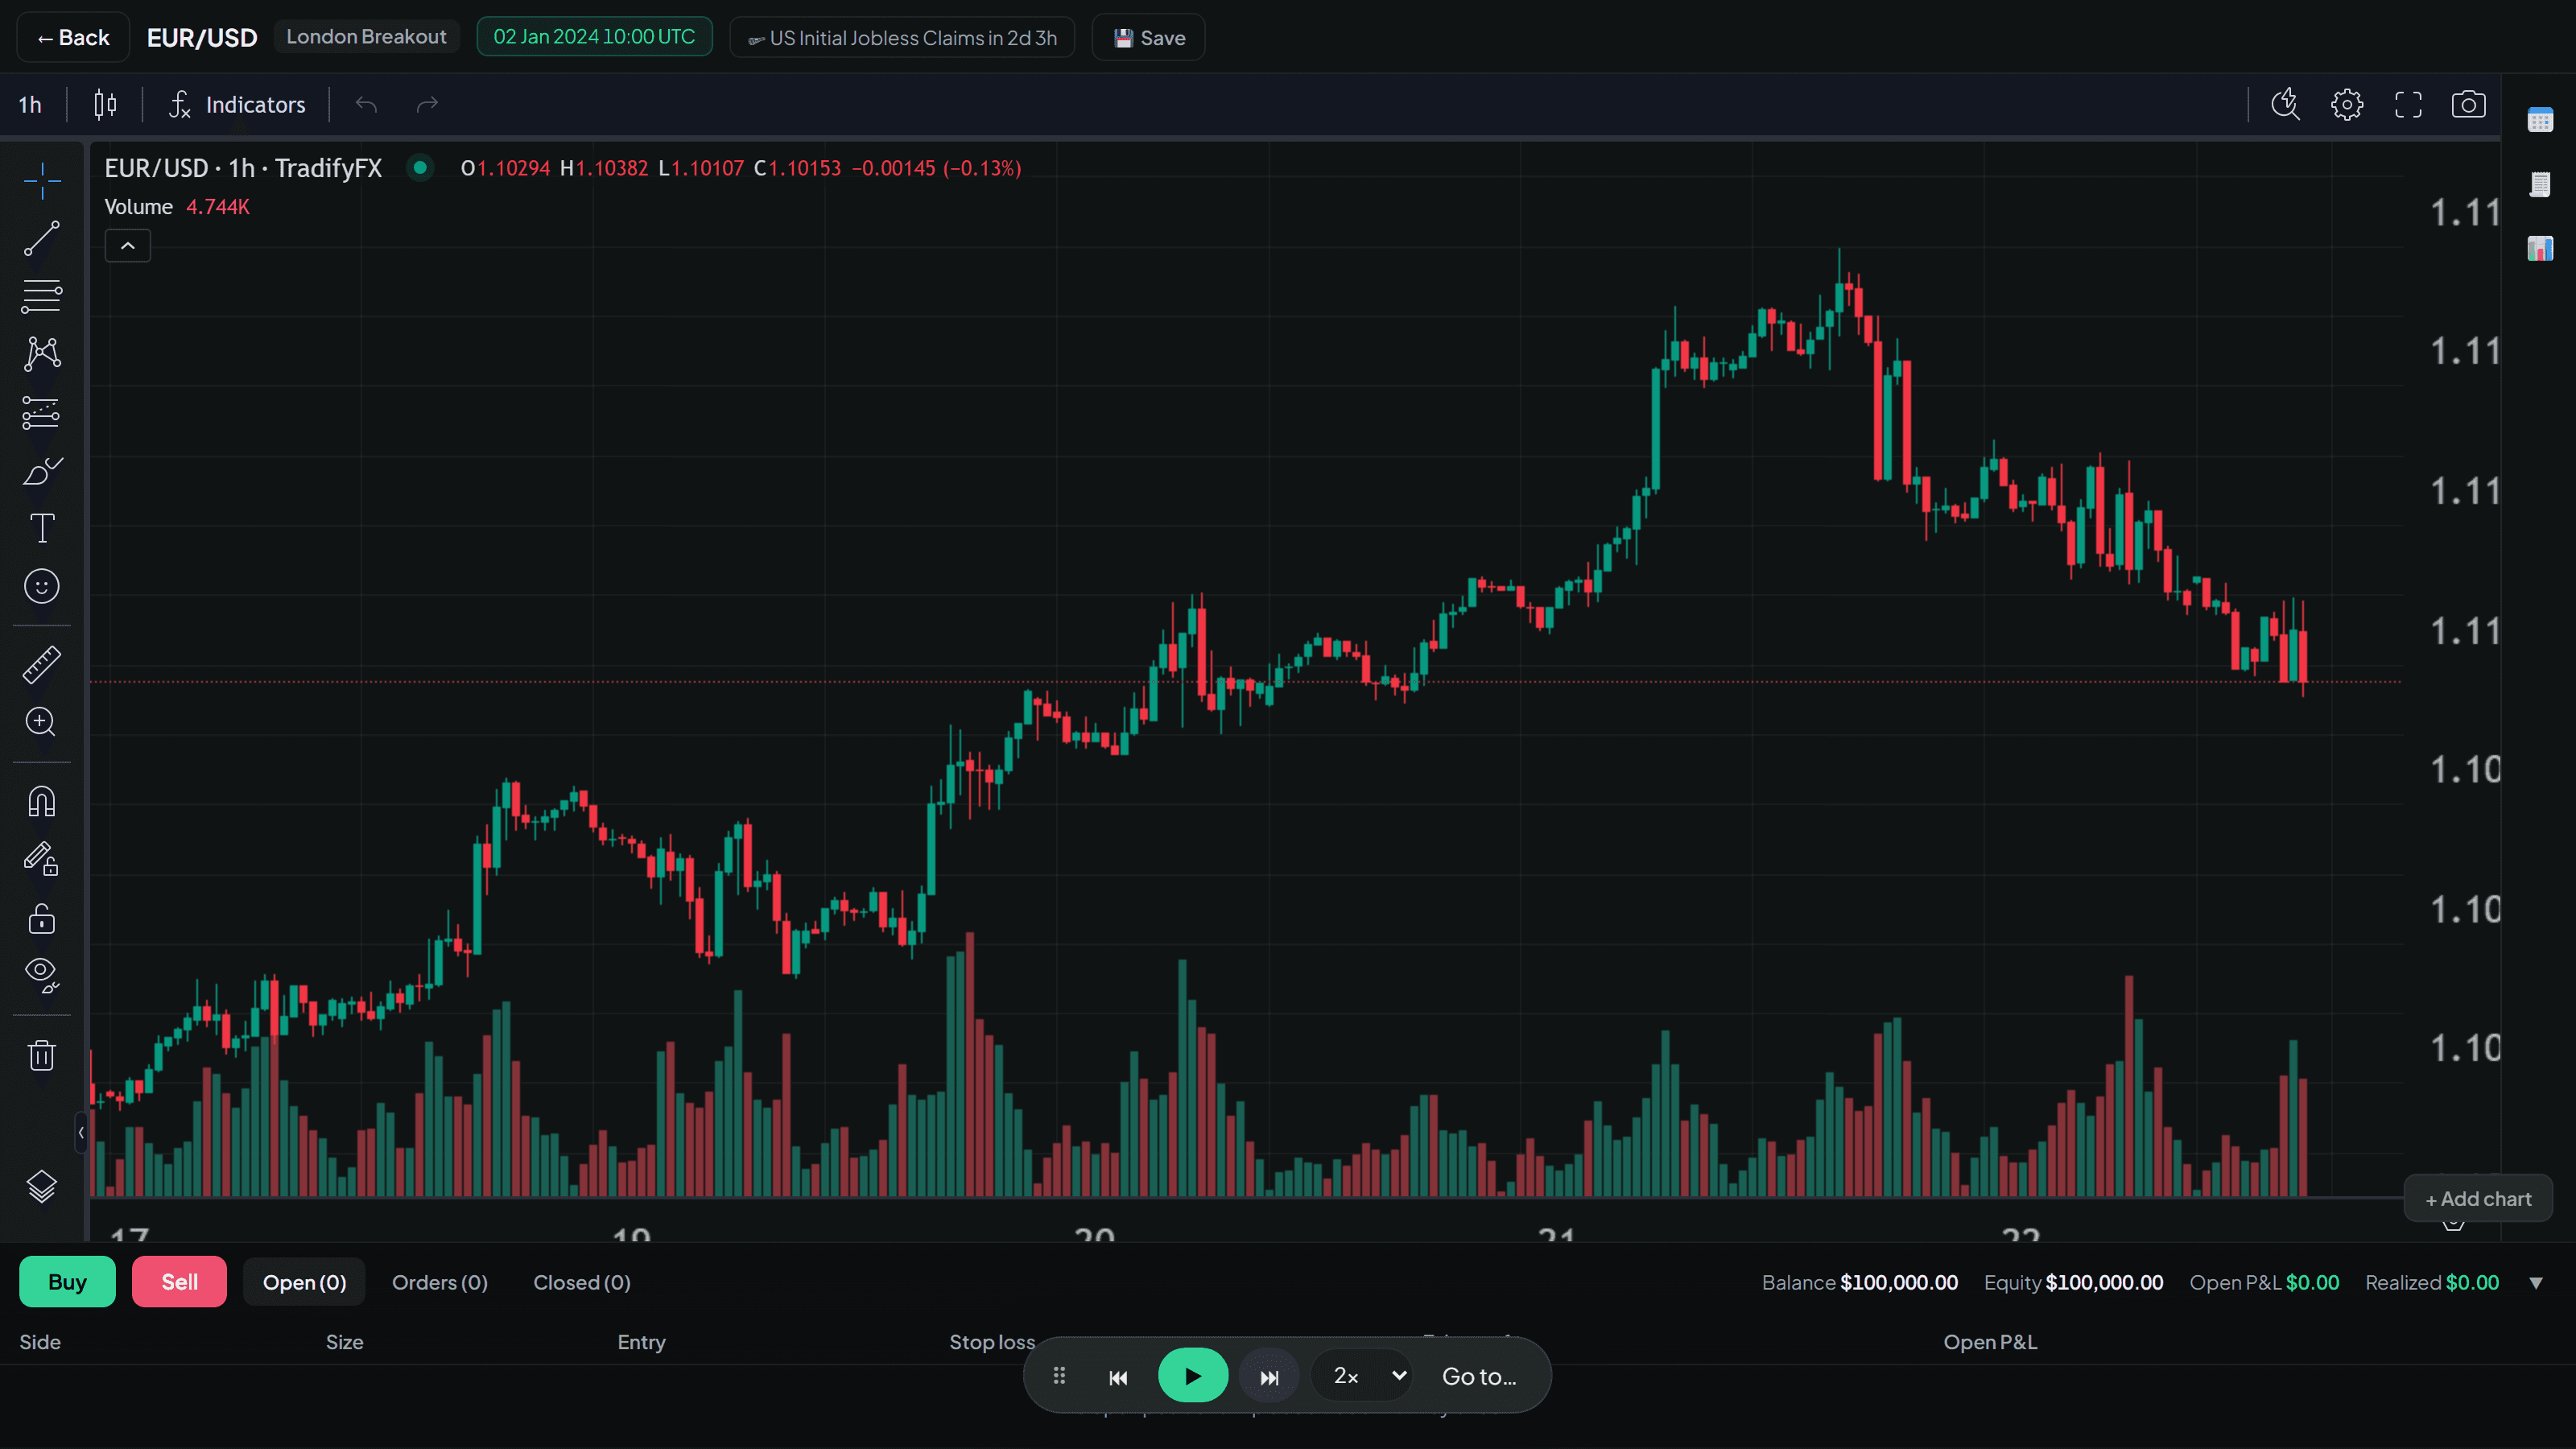
The top bar

Left to right:
Item | What it does |
|---|---|
Back | Leaves the session. You are asked whether to end it or keep it open. |
Market and strategy | Which pair you are trading, and which strategy this session belongs to. |
The clock | Where you are in history. This is simulated time, not today’s date. |
News chip | The next scheduled economic release, counting down in simulated time. |
Save chip | Shows when your chart layout was last saved. Click it to save immediately. |
The chart
A full TradingView chart with the drawing tools down the left and the indicator menu along the top. Anything you draw is saved against the strategy name and comes back next time.
The key rule: the chart never shows you a candle that had not finished at your current clock time. That is what stops you seeing the future.
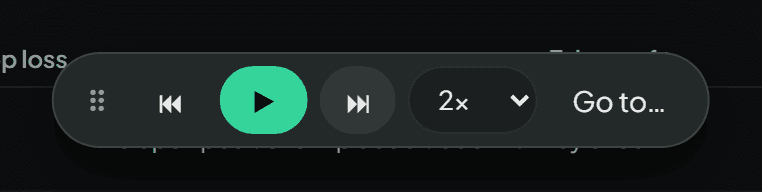
The controls
Control | What it does |
|---|---|
Step back | Rewinds one candle. |
Play / pause | Runs the replay continuously. |
Step forward | Prints the next candle. |
Speed | 1x, 2x, 5x, 10x or 16x while playing. |
Go to | Jumps to a specific date and time. |
You can drag this bar anywhere on screen, and it stays where you put it next time.
The trading bar

Buy and Sell open the order ticket. The tabs next to them show Open positions, working Orders and Closed trades. On the right you get your balance, your equity, and your profit and loss — open and realised.
Keyboard shortcuts
Faster than the mouse once you are used to them:
Key | Action |
|---|---|
| Play or pause |
| Step forward |
| Step back |
| Buy |
| Sell |
| Close the order ticket |
Related articles
In this topic
Still stuck?
Tell us the strategy name and roughly when it happened, and we’ll look at the exact session.
Contact support


