
Session breakdowns
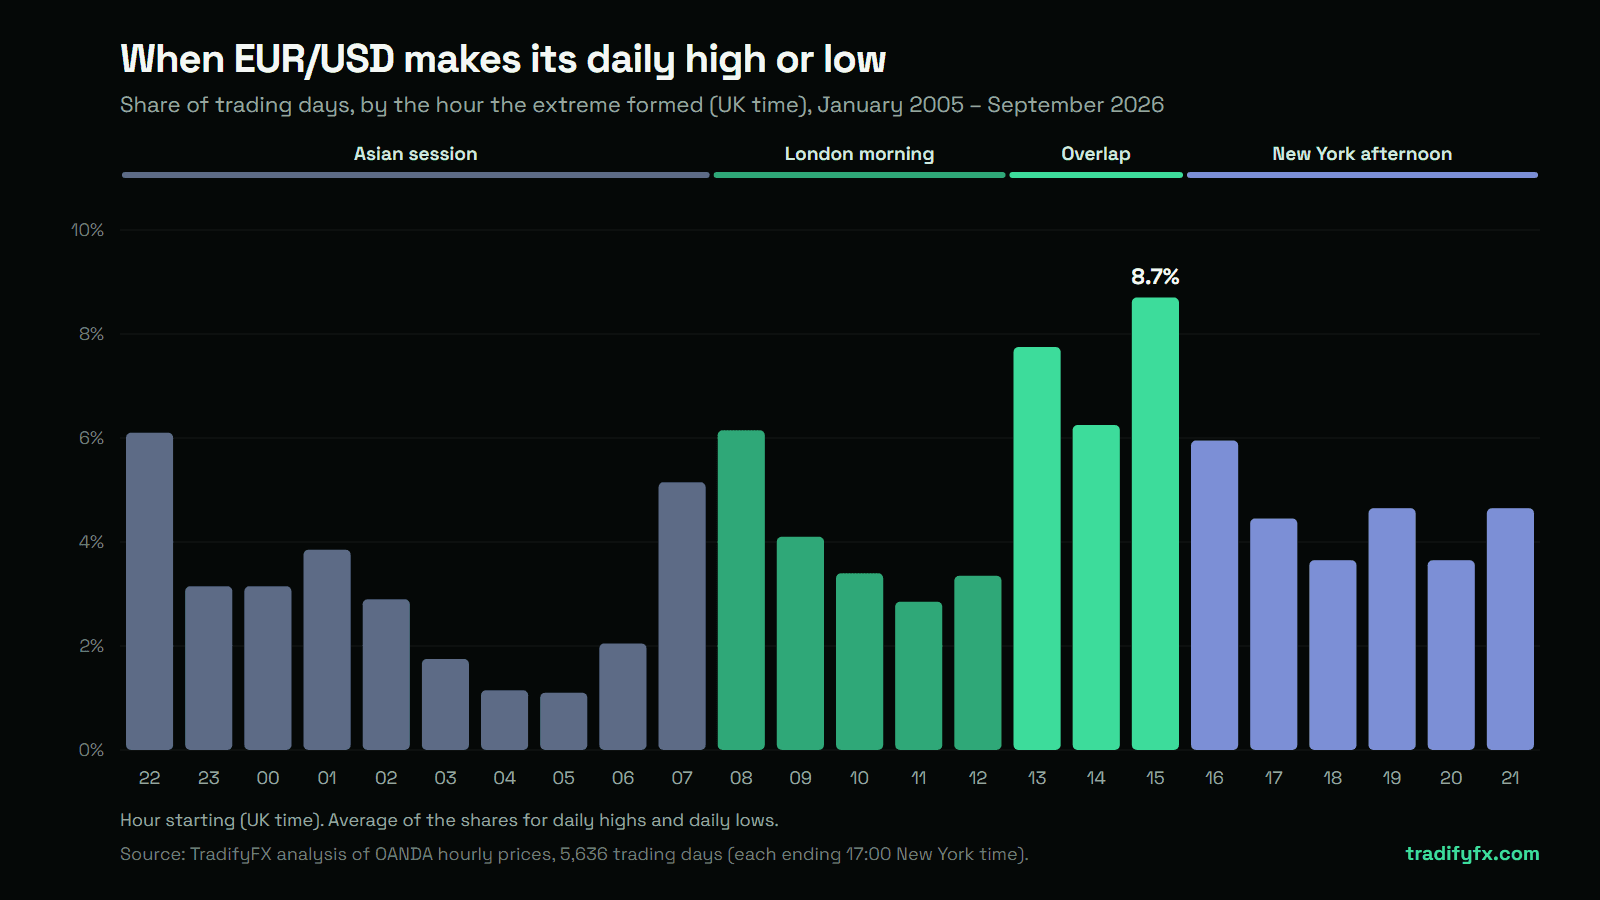
We checked 5,636 trading days of EUR/USD since 2005. Per hour, the London–New York overlap sets the day's high or low more often than any other session.
TF
TradifyFX Team
·
·
4
min read

Across 5,636 trading days from January 2005 to September 2026, EUR/USD made its daily high or low most often between 13:00 and 15:59 UK time, the three hours when London and New York are both open. Those three hours produced 22.0% of daily highs and 23.6% of daily lows. Hour for hour, that is about 2.5 times the rate of the Asian session. The single busiest hour was 15:00–16:00 UK time.
We measured this from the same OANDA price history that TradifyFX replays. The method and every caveat are below, so you can check the figures or repeat the analysis yourself.
The short answer
Per hour, the London–New York overlap sets the day’s extremes more often than any other session: 7.6% of days per hour, against 3.0% for the Asian session.
The Asian session still produces about 30% of highs and lows, but only because it is ten hours long.
The three busiest hours were 15:00–16:00 (8.7%), 13:00–14:00 (7.8%), 14:00–15:00 (6.3%).
The high and the low came from the same session on only 7.7% of days. Most days, the two ends of the range are set in different sessions.
On 70.1% of days, at least one of the two extremes formed between 08:00 and 15:59 UK time. That share moved between 59.5% and 78.5% from one year to the next.
How we measured it
Data: OANDA hourly mid prices (the average of bid and ask) for EUR/USD, 137,889 hourly candles from 2005-01-02 to 2026-09-25.
Trading day: the 24 hours ending 17:00 New York time, the convention behind the standard forex daily candle. Days with fewer than 20 hourly candles, such as holidays, were left out.
The extreme: for each day, the hourly candle with the highest high and the one with the lowest low. Each extreme is assigned to the hour in which it formed.
Sessions: grouped in UK time, so British and American clock changes are handled. The trading day usually starts at 22:00 UK time.
Resolution: hourly. A high set at 15:59 counts for the 15:00 hour.
Share of daily highs and lows by session
EUR/USD, 5,636 trading days. “Per hour” divides the session’s average share by its length, which is the fair way to compare a ten-hour session with a three-hour one.
Session (UK time) | Hours | Daily highs | Daily lows | Per hour |
|---|---|---|---|---|
Asian session (22:00–07:59) | 10 | 31.0% | 29.7% | 3.0% |
London morning (08:00–12:59) | 5 | 20.4% | 19.3% | 4.0% |
London–New York overlap (13:00–15:59) | 3 | 22.0% | 23.6% | 7.6% |
New York afternoon (16:00–21:59) | 6 | 26.6% | 27.4% | 4.5% |
The hours that stand out
08:00–09:00 UK: the London open, when European liquidity arrives.
13:00–14:00 UK: US economic data is released at 8:30 New York time (13:30 UK for most of the year), and New York traders arrive.
15:00–16:00 UK: the hour leading into 16:00 UK, the time of the WM/Reuters London closing benchmark rate. Several US data releases also land at 10:00 New York time (15:00 UK).
22:00–23:00 UK: the first hour of the trading day. Part of this is mechanical: a day’s first candle often marks one end of the range simply because nothing has traded before it.
Other markets show the same shape
Market | Days | Overlap per hour | Asian session per hour | Busiest session per hour | High and low in the same session |
|---|---|---|---|---|---|
GBP/USD | 5,636 | 6.8% | 3.0% | Overlap | 6.9% |
USD/JPY | 5,636 | 6.2% | 4.2% | Overlap | 9.9% |
Gold (XAU/USD) | 4,530 | 8.7% | 3.4% | Overlap | 9.1% |
USD/JPY makes more of its highs and lows in the Asian session than the other markets (40.5% of highs), as you would expect from a yen pair, yet per hour the overlap still leads. Gold’s data starts in January 2009.
What this means when you backtest
Check which part of the day your strategy is present for. If you only trade the London morning (08:00–12:59 UK), the day’s high formed during those hours on 20.4% of days and the low on 19.3%. On about four days in five, the high was set outside those hours, and the same is true of the low.
Test across years, not weeks. The share of days with at least one extreme between 08:00 and 15:59 UK was 19 percentage points higher in the busiest year than in the quietest. A few weeks of results can land at either end of that range.
Replay the hours that matter. In TradifyFX you can shade the trading sessions on the chart, jump straight to a date and time, and step through the overlap tick by tick to see how the day’s high or low actually formed. See drawings and indicators for the session shading.
Limitations
These are historical frequencies, not a forecast. They say nothing about which way price moves, and they are not trading advice.
Hourly candles cannot separate two extremes set within the same hour.
A different definition of the trading day (for example, UTC midnight) shifts the share of the first hour.
Mid prices ignore the spread, which can matter for an extreme set by a quick spike.
*You are welcome to cite these figures with a link to this page. Data: OANDA hourly prices, analysed by TradifyFX on 29 September 2026.*
TF
TradifyFX Team
The people building TradifyFX. We replay the market so you can practise on it.


